Technical Analysis of OSCV 2024-05-31
Overview:
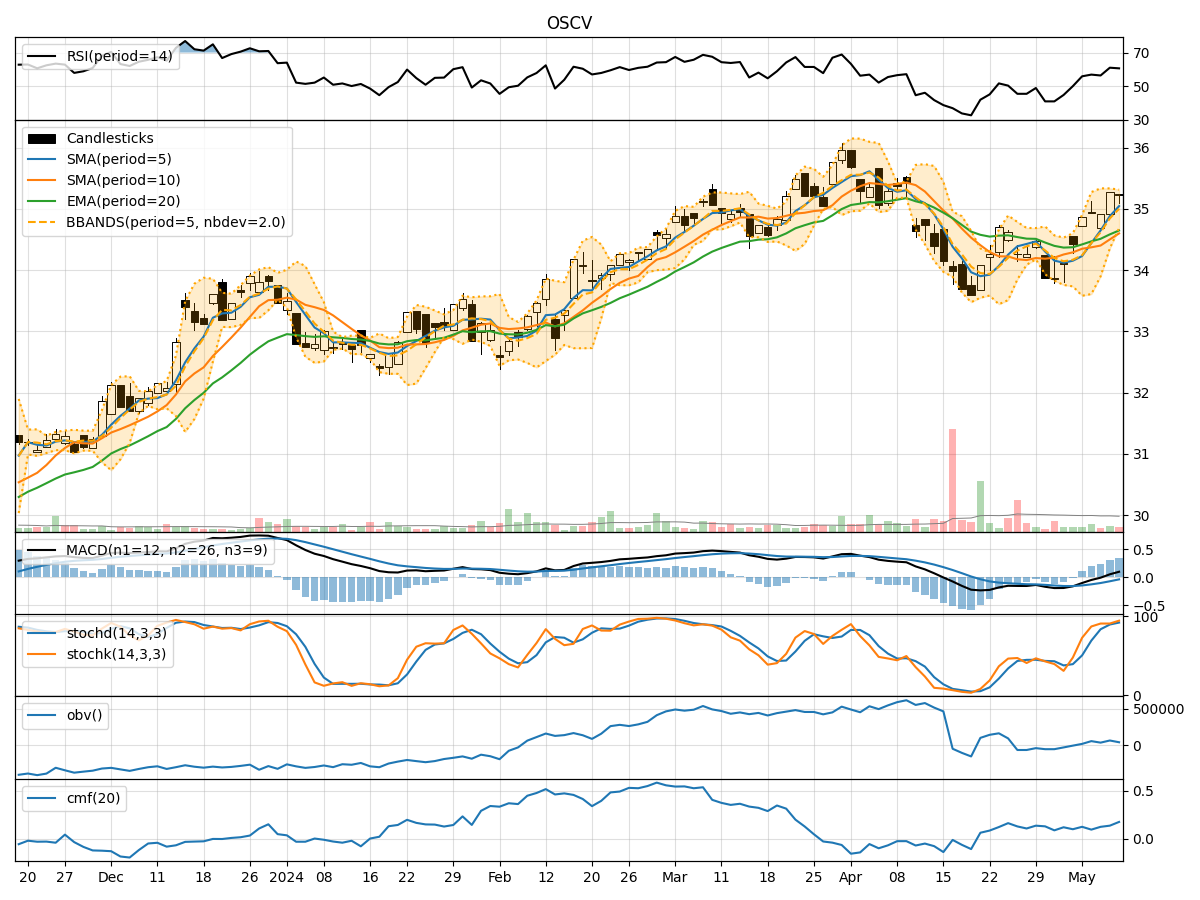
In the last 5 trading days, the stock has shown a mixed performance based on various technical indicators. The trend indicators suggest a slight bearish sentiment, with the moving averages and MACD showing a downward trend. Momentum indicators also indicate a weakening momentum, while volatility indicators show a narrowing Bollinger Bands range. Volume indicators suggest a decrease in buying pressure.
Trend Indicators Analysis:
- Moving Averages (MA): The 5-day MA is below the 10-day SMA, indicating a short-term bearish trend.
- MACD: The MACD line is below the signal line, indicating a bearish signal.
- EMA: The EMA is also trending downwards, supporting the bearish sentiment.
Momentum Indicators Analysis:
- RSI: The RSI is below 50, indicating a weakening momentum.
- Stochastic Oscillator: Both %K and %D are below 20, suggesting an oversold condition.
- Williams %R: The indicator is below -80, indicating a potential oversold condition.
Volatility Indicators Analysis:
- Bollinger Bands (BB): The bands are narrowing, suggesting decreasing volatility.
- BB %B: The %B is below 0.2, indicating a potential oversold condition.
Volume Indicators Analysis:
- On-Balance Volume (OBV): The OBV is negative, suggesting selling pressure.
- Chaikin Money Flow (CMF): The CMF is negative, indicating a decrease in buying pressure.
Key Observations:
- The stock is currently in a short-term bearish trend based on moving averages and MACD.
- Momentum indicators suggest a weakening momentum and potential oversold conditions.
- Volatility is decreasing, indicating a possible consolidation phase.
- Volume indicators show a decrease in buying pressure.
Conclusion:
Based on the analysis of the technical indicators, the stock is likely to experience further downward movement in the next few days. The bearish trend indicated by moving averages and MACD, coupled with weakening momentum and oversold conditions, suggests a potential continuation of the current downtrend. Additionally, the decrease in buying pressure and narrowing volatility further support a bearish outlook. Traders should consider short positions or wait for a more favorable entry point before considering long positions.