Technical Analysis of PAUG 2024-05-31
Overview:
In analyzing the technical indicators for PAUG stock over the last 5 days, we will delve into the trend, momentum, volatility, and volume indicators to provide a comprehensive outlook on the possible future stock price movement. By examining these key aspects, we aim to offer valuable insights and predictions for the upcoming trading days.
Trend Analysis:
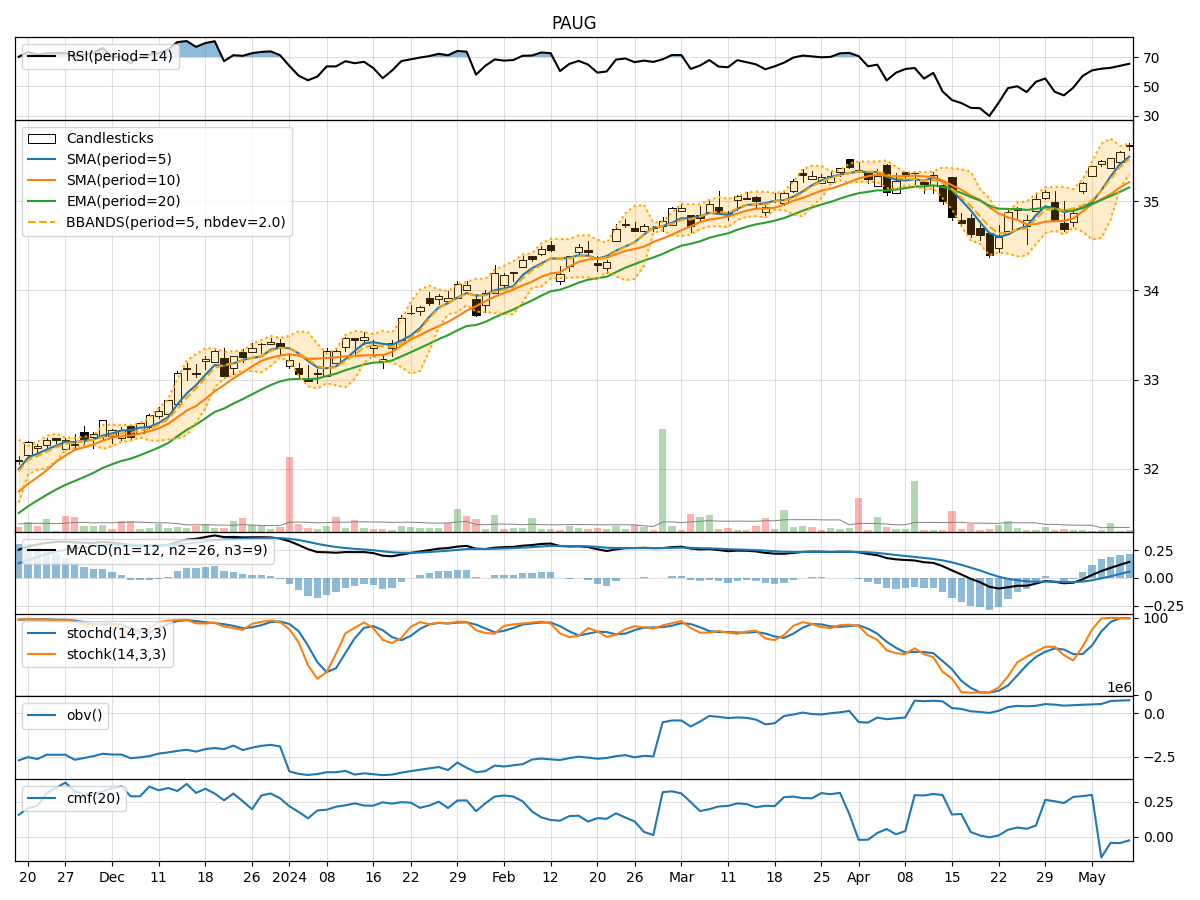
- Moving Averages (MA): The 5-day MA has been relatively stable around the current price levels, indicating a neutral trend.
- MACD: The MACD line has been hovering around the signal line, suggesting a lack of strong momentum in either direction.
- RSI: The RSI has shown fluctuations but has not reached extreme overbought or oversold levels, reflecting a balanced market sentiment.
Momentum Analysis:
- Stochastic Oscillator: The Stochastic indicators have been declining, signaling a potential bearish momentum.
- Williams %R (WillR): The WillR indicator has been moving towards oversold territory, indicating a possible reversal to the upside.
Volatility Analysis:
- Bollinger Bands (BB): The Bollinger Bands have been narrowing, indicating decreasing volatility and a potential period of consolidation.
- Average True Range (ATR): The ATR has shown a decrease in volatility, suggesting a calmer market environment.
Volume Analysis:
- On-Balance Volume (OBV): The OBV has been fluctuating, indicating mixed buying and selling pressure.
- Chaikin Money Flow (CMF): The CMF has been oscillating around the zero line, reflecting a balance between buying and selling pressure.
Key Observations:
- The trend indicators suggest a neutral stance with no clear directional bias.
- Momentum indicators point towards a potential bearish momentum in the short term.
- Volatility indicators indicate a period of consolidation and reduced price fluctuations.
- Volume indicators show mixed signals with no strong accumulation or distribution pattern.
Conclusion:
Based on the analysis of the technical indicators, the next few days for PAUG stock are likely to see sideways movement with a slight bearish bias. Traders should exercise caution and closely monitor key support and resistance levels for potential entry and exit points. It is advisable to wait for more definitive signals before taking significant trading positions.