Technical Analysis of PCRB 2024-05-31
Overview:
In analyzing the technical indicators for PCRB over the last 5 days, we will delve into the trend, momentum, volatility, and volume indicators to provide a comprehensive outlook on the possible stock price movement. By examining these key aspects, we aim to offer valuable insights and predictions for the upcoming days.
Trend Analysis:
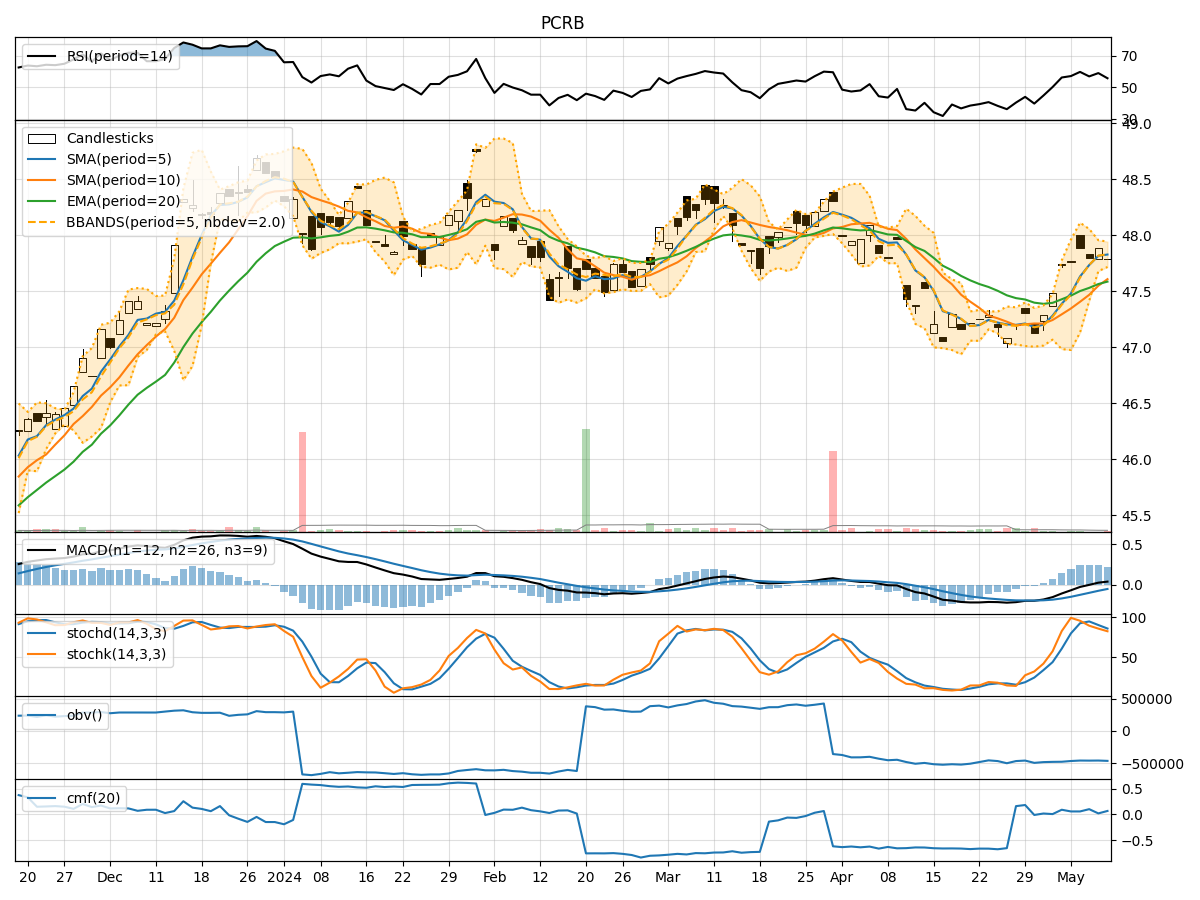
- Moving Averages (MA): The 5-day MA has been fluctuating around the closing prices, indicating short-term price trends. The SMA(10) and EMA(20) have shown a slight decline, suggesting a weakening trend.
- Moving Average Convergence Divergence (MACD): The MACD and Signal line have been relatively close, with the MACD Histogram showing a decreasing trend, signaling a potential bearish momentum.
Momentum Analysis:
- Relative Strength Index (RSI): The RSI has been fluctuating around the mid-level, indicating a balanced momentum without strong overbought or oversold conditions.
- Stochastic Oscillator: Both %K and %D have shown a mixed trend, with %K crossing %D, suggesting a potential reversal in momentum.
Volatility Analysis:
- Bollinger Bands (BB): The bands have been narrowing, indicating decreasing volatility and a potential price breakout in the near future.
- Bollinger %B (BBP): The %B has been fluctuating around the mid-level, suggesting a neutral stance in terms of volatility.
Volume Analysis:
- On-Balance Volume (OBV): The OBV has shown a declining trend, indicating selling pressure in the market.
- Chaikin Money Flow (CMF): The CMF has been positive, suggesting a potential inflow of money into the stock.
Key Observations and Opinions:
- Trend: The trend indicators point towards a weakening trend, with the potential for a bearish bias in the short term.
- Momentum: The momentum indicators suggest a mixed sentiment, with a possible reversal in momentum direction.
- Volatility: Volatility is decreasing, indicating a period of consolidation and a potential breakout in price.
- Volume: The declining OBV signals selling pressure, while the positive CMF hints at some buying interest.
Conclusion:
Based on the analysis of the technical indicators, the next few days for PCRB could see sideways movement with a slight bearish bias. Traders should watch for potential price breakouts as volatility decreases. It is advisable to closely monitor the trend indicators for any confirmation of a sustained downward movement. Additionally, keeping an eye on the momentum indicators for a potential shift in sentiment would be crucial for making informed trading decisions.