Technical Analysis of PGHY 2024-05-31
Overview:
In analyzing the technical indicators for PGHY over the last 5 days, we will delve into the trend, momentum, volatility, and volume indicators to provide a comprehensive outlook on the possible stock price movement in the coming days. By examining these key aspects, we aim to offer valuable insights and predictions for potential investors.
Trend Analysis:
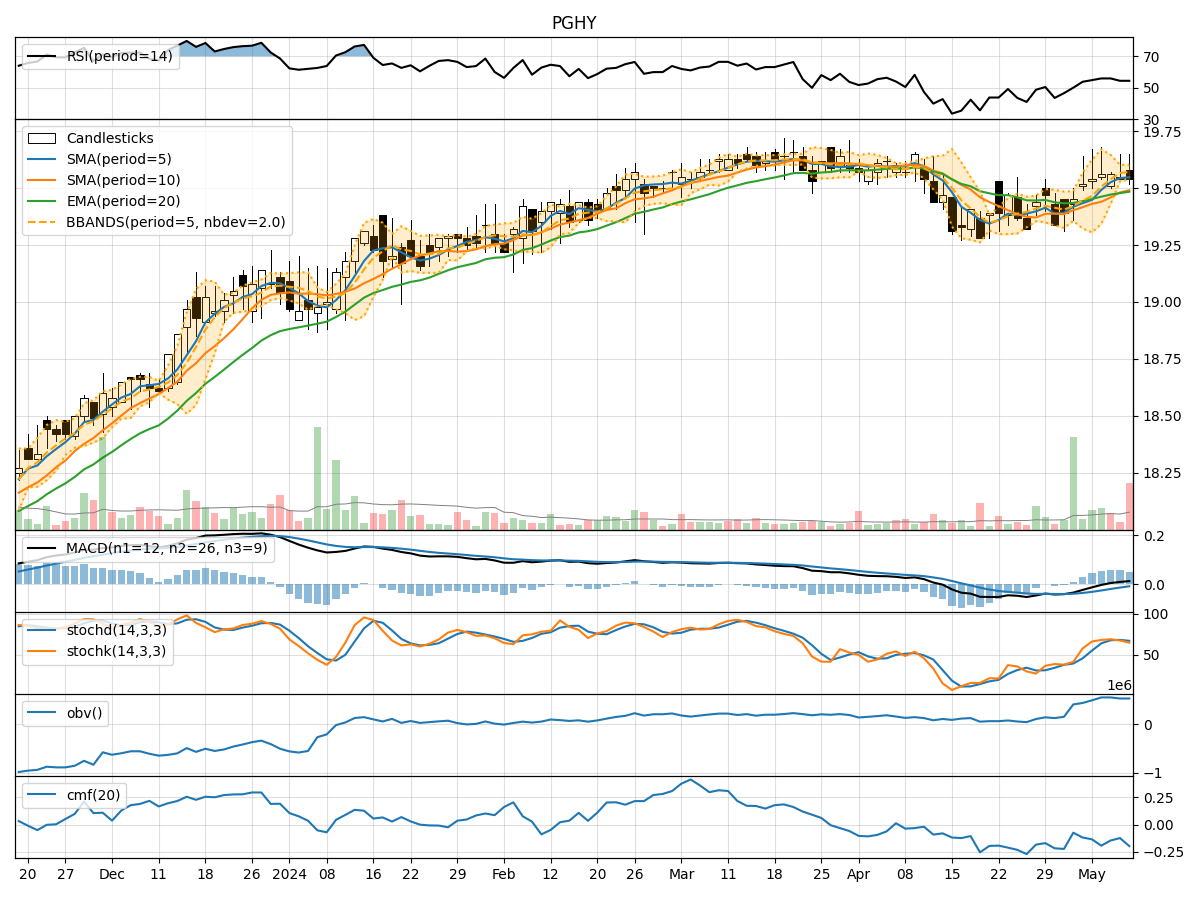
- Moving Averages (MA): The 5-day MA has been relatively stable around the closing prices, indicating a consistent trend.
- MACD: The MACD line has shown a slight positive trend, with the MACD histogram also displaying an uptick, suggesting a potential bullish momentum.
Momentum Analysis:
- RSI: The RSI values have been fluctuating but generally staying within the neutral range, indicating a balanced momentum.
- Stochastic Oscillator: The Stochastic indicators have shown some variability but are not in extreme overbought or oversold territory, suggesting a neutral momentum.
Volatility Analysis:
- Bollinger Bands (BB): The Bollinger Bands have shown narrowing bands, indicating decreasing volatility and a potential upcoming price breakout.
Volume Analysis:
- On-Balance Volume (OBV): The OBV has been fluctuating but has not shown a clear trend, suggesting mixed sentiment among investors.
- Chaikin Money Flow (CMF): The CMF has been negative, indicating potential selling pressure in the stock.
Key Observations:
- The trend indicators suggest a slightly bullish sentiment, supported by the MACD.
- Momentum indicators show a neutral stance, with no extreme overbought or oversold conditions.
- Volatility is decreasing, potentially signaling a period of consolidation before a breakout.
- Volume indicators reflect mixed sentiment among investors, with no clear trend in buying or selling pressure.
Conclusion:
Based on the analysis of the technical indicators, the stock price of PGHY is likely to experience sideways movement in the coming days, with a potential for a bullish breakout due to the positive trend indicators like the MACD. However, the mixed sentiment in volume indicators and the neutral momentum suggest a cautious approach. Investors should closely monitor the price action for any signs of a confirmed trend before making significant trading decisions.