Technical Analysis of PJAN 2024-05-31
Overview:
In analyzing the technical indicators for PJAN stock over the last 5 days, we will delve into the trends, momentum, volatility, and volume indicators to provide a comprehensive outlook on the possible stock price movement in the coming days. By examining these key aspects, we aim to offer valuable insights and recommendations for potential investors.
Trend Indicators:
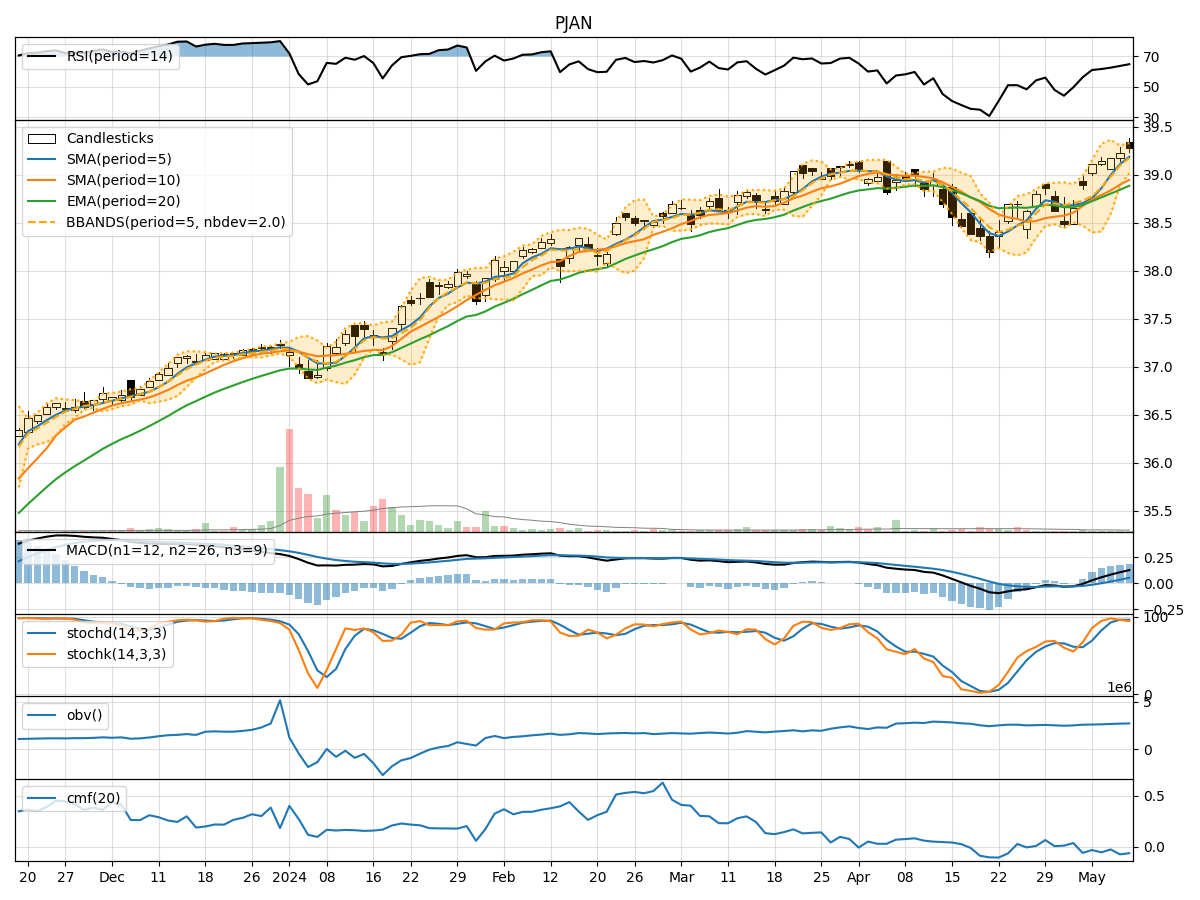
- Moving Averages (MA): The 5-day moving average has been relatively stable around the closing prices, indicating a short-term trend. Both the simple moving average (SMA) and exponential moving average (EMA) have shown a slight upward trend.
- MACD: The MACD line has been positive, indicating a bullish momentum, although the MACD histogram has shown a slight decrease in momentum.
- Conclusion: The trend indicators suggest a slightly bullish outlook for the stock in the short term.
Momentum Indicators:
- RSI: The Relative Strength Index (RSI) has been fluctuating around the neutral zone, indicating a balanced momentum between buying and selling pressure.
- Stochastic Oscillator: Both %K and %D have been declining, suggesting a weakening momentum.
- Williams %R: The Williams %R has been in the oversold territory, indicating a potential reversal.
- Conclusion: The momentum indicators point towards a neutral to slightly bearish sentiment for the stock.
Volatility Indicators:
- Bollinger Bands: The stock price has been trading within the Bollinger Bands, with the bands narrowing, indicating decreasing volatility.
- Conclusion: Volatility indicators suggest a consolidation phase for the stock with a potential breakout in either direction.
Volume Indicators:
- On-Balance Volume (OBV): The OBV has shown a slight decrease, indicating some distribution of the stock.
- Chaikin Money Flow (CMF): The CMF has been positive, suggesting buying pressure in the market.
- Conclusion: Volume indicators imply a mixed sentiment with a slight bias towards selling pressure.
Overall Conclusion:
Based on the analysis of trend, momentum, volatility, and volume indicators, the next few days' possible stock price movement for PJAN is likely to be sideways with a slight bullish bias. The trend indicators support a bullish outlook, while momentum indicators signal a neutral to slightly bearish sentiment. Volatility indicators point towards a consolidation phase, and volume indicators indicate a mixed sentiment with a slight bias towards selling pressure.
Investors should closely monitor key levels such as support and resistance to identify potential breakout points. It is essential to consider the overall market conditions and any upcoming news or events that could impact the stock price movement. Conducting further analysis and staying updated with the latest market developments will be crucial for making informed investment decisions.