Technical Analysis of PMAY 2024-05-31
Overview:
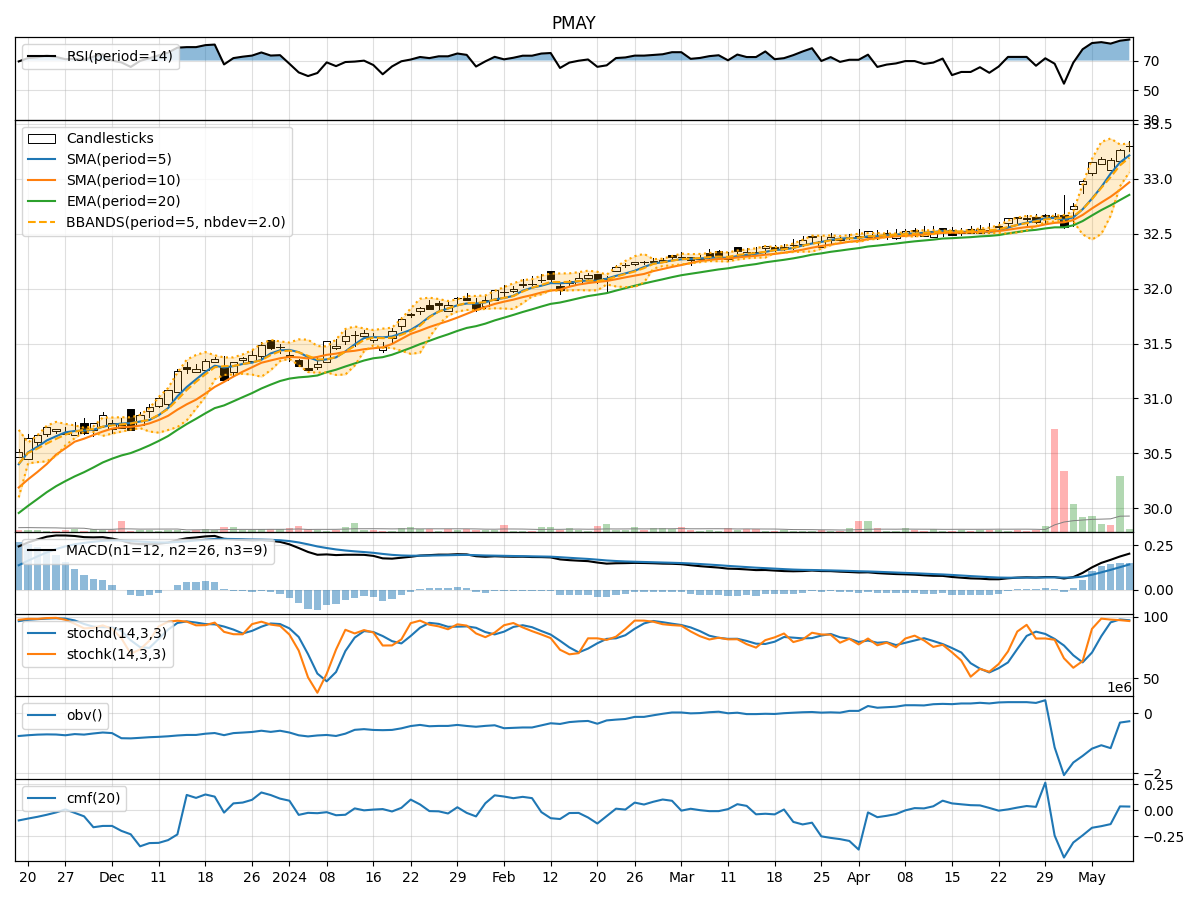
In the last 5 trading days, PMAY stock has shown mixed signals across various technical indicators. The stock price has been relatively stable, with minor fluctuations. The trend indicators suggest a neutral to slightly bullish sentiment, while momentum indicators show a weakening trend. Volatility indicators indicate a narrowing of price movements, and volume indicators reflect a decrease in buying pressure.
Trend Analysis:
- Moving averages (MA) show a slight uptrend, with the 5-day MA consistently above the 10-day simple moving average (SMA).
- Exponential moving average (EMA) has been gradually increasing, indicating a positive trend.
- MACD line has been hovering around the signal line, suggesting a lack of strong momentum.
- MACD histogram has been decreasing, indicating a potential slowdown in price momentum.
Momentum Analysis:
- Relative Strength Index (RSI) has been relatively high but has started to decline, indicating a possible weakening of buying pressure.
- Stochastic oscillators show a bearish crossover, suggesting a potential reversal in price direction.
- Williams %R indicator is in oversold territory, indicating a possible upcoming price bounce.
Volatility Analysis:
- Bollinger Bands are narrowing, indicating decreasing volatility and a potential period of consolidation.
- Bollinger Band %B indicator is hovering around the midline, suggesting a balanced market sentiment.
Volume Analysis:
- On-Balance Volume (OBV) has been fluctuating, indicating indecision among investors.
- Chaikin Money Flow (CMF) has been positive but declining, signaling a decrease in buying pressure.
Conclusion:
Based on the analysis of technical indicators, the next few days for PMAY stock are likely to see sideways movement with a slight bearish bias. The weakening momentum, bearish crossover in stochastic oscillators, and declining RSI suggest a potential pullback in stock price. The narrowing Bollinger Bands and decreasing OBV further support the view of a consolidation phase. Traders should exercise caution and consider waiting for clearer signals before making any significant trading decisions.