Technical Analysis of PSCJ 2024-05-31
Overview:
In analyzing the technical indicators for PSCJ stock over the last 5 days, we will delve into the trend, momentum, volatility, and volume indicators to provide a comprehensive outlook on the possible stock price movement in the coming days. By examining these key aspects, we aim to offer valuable insights and predictions for potential investors.
Trend Indicators:
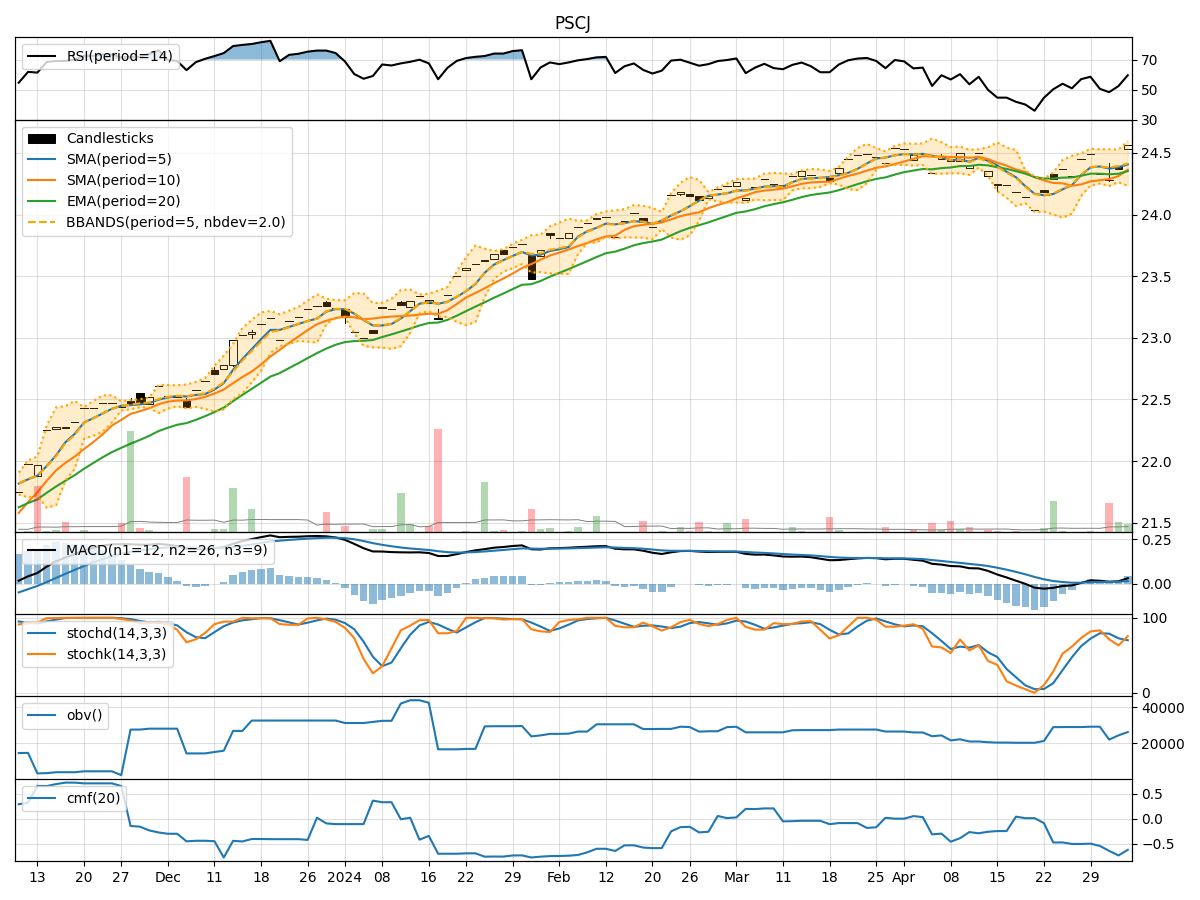
- Moving Averages (MA): The 5-day MA has been fluctuating around the closing prices, indicating a relatively stable trend.
- MACD: The MACD line has shown a slight positive trend, with the MACD histogram hovering around the zero line.
- EMA: The EMA has been gradually increasing, suggesting a bullish sentiment in the short term.
Key Observation: The trend indicators point towards a slightly bullish outlook for the stock.
Momentum Indicators:
- RSI: The RSI values have been fluctuating in the neutral zone, indicating a lack of strong momentum.
- Stochastic Oscillator: Both %K and %D values have been declining, signaling a potential weakening of momentum.
- Williams %R: The Williams %R values have been oscillating in the oversold territory.
Key Observation: The momentum indicators suggest a neutral to slightly bearish momentum for the stock.
Volatility Indicators:
- Bollinger Bands: The stock price has been trading within the Bollinger Bands, with the bands widening slightly, indicating increased volatility.
- Bollinger %B: The %B values have been fluctuating within the bands, suggesting no clear trend.
- Average True Range (ATR): The ATR values have shown a slight increase, indicating a rise in volatility.
Key Observation: Volatility indicators point towards increased volatility in the stock.
Volume Indicators:
- On-Balance Volume (OBV): The OBV values have been fluctuating, indicating a lack of strong buying or selling pressure.
- Chaikin Money Flow (CMF): The CMF values have been negative, suggesting a bearish money flow trend.
Key Observation: Volume indicators reflect a neutral to slightly bearish sentiment in terms of trading volume.
Conclusion:
Based on the analysis of trend, momentum, volatility, and volume indicators, the overall outlook for PSCJ stock in the next few days is as follows: - Trend: Slightly bullish - Momentum: Neutral to slightly bearish - Volatility: Increased volatility - Volume: Neutral to slightly bearish
Final Verdict:
Considering the mixed signals from the technical indicators, the stock is likely to experience sideways movement with a slight bullish bias in the coming days. Investors should closely monitor key support and resistance levels for potential entry or exit points.