Technical Analysis of PSMR 2024-05-31
Overview:
In analyzing the provided PSMR TA data for the last 5 days, we will delve into the technical indicators across trend, momentum, volatility, and volume to derive insights into the possible future stock price movement. By examining these indicators, we aim to provide a comprehensive and well-informed prediction for the upcoming days.
Trend Analysis:
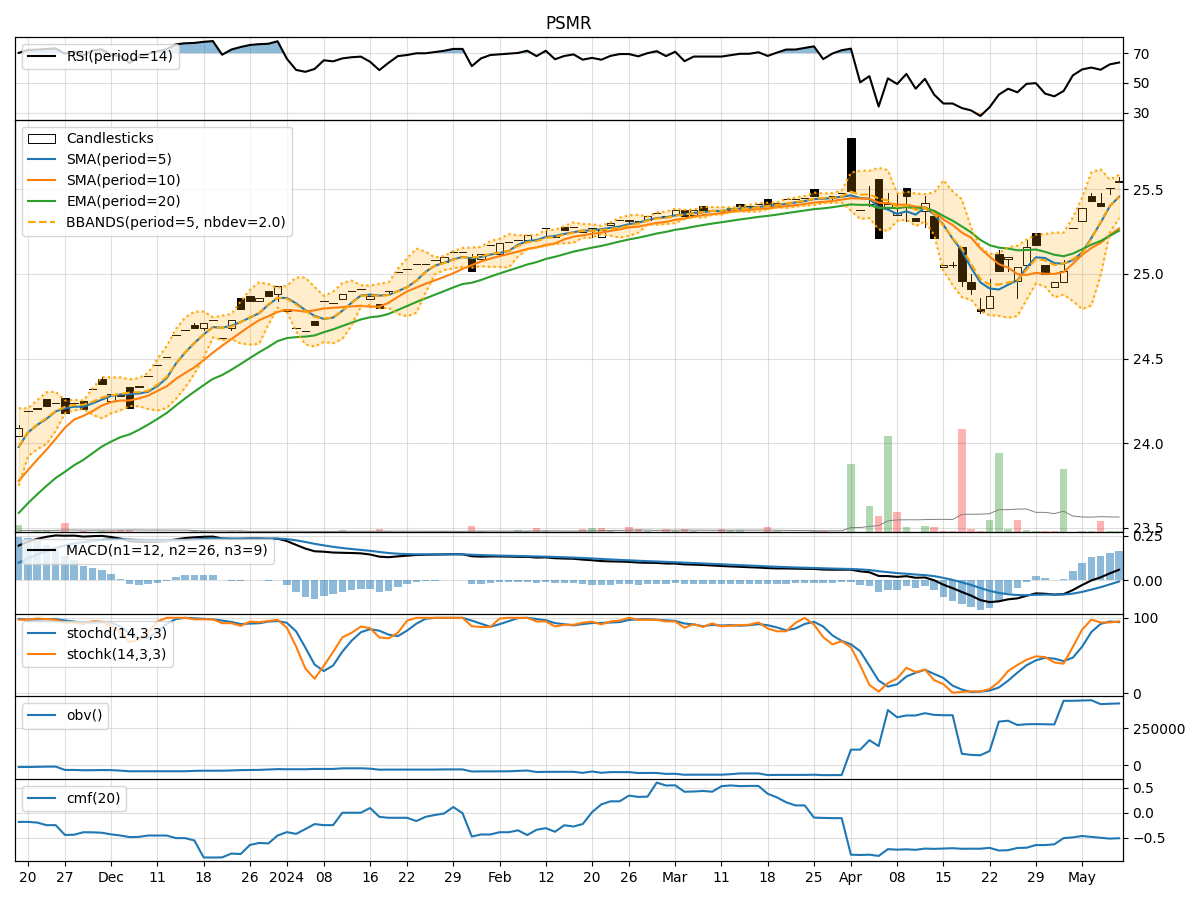
- Moving Averages (MA): The 5-day MA has been fluctuating around the closing prices, indicating short-term price trends. The SMA(10) and EMA(20) have shown a slight upward trend, suggesting a positive momentum.
- MACD: The MACD line has been consistently positive, with the MACD histogram showing a decreasing trend, potentially signaling a slowdown in the bullish momentum.
Momentum Analysis:
- RSI: The RSI values have been fluctuating around the mid-range, indicating a lack of strong momentum in either direction.
- Stochastic Oscillator: Both %K and %D values have been declining, suggesting a weakening bullish momentum.
- Williams %R: The indicator has been moving towards oversold territory, indicating a potential reversal in the short term.
Volatility Analysis:
- Bollinger Bands (BB): The bands have been narrowing, indicating decreasing volatility in the stock price.
- Bollinger %B: The %B values have been fluctuating around the midline, suggesting a lack of clear direction in price movement.
Volume Analysis:
- On-Balance Volume (OBV): The OBV has been fluctuating, indicating a balance between buying and selling pressure.
- Chaikin Money Flow (CMF): The CMF has been negative, indicating a bearish money flow in the short term.
Key Observations:
- The trend indicators suggest a potential continuation of the current upward trend, albeit with some signs of a slowdown.
- Momentum indicators point towards a weakening bullish momentum and a possible short-term reversal.
- Volatility indicators indicate decreasing volatility, which could lead to a period of consolidation.
- Volume indicators show a balance between buying and selling pressure, with a bearish money flow in the short term.
Conclusion:
Based on the analysis of the technical indicators, the stock is likely to experience sideways movement in the upcoming days, with a potential bearish bias in the short term. Traders should exercise caution and consider waiting for more clarity in the market direction before making significant trading decisions.