Technical Analysis of PYZ 2024-05-31
Overview:
In analyzing the technical indicators for PYZ stock over the last 5 days, we will delve into the trend, momentum, volatility, and volume indicators to provide a comprehensive outlook on the possible future stock price movement. By examining these key indicators, we aim to offer valuable insights and predictions for the upcoming trading days.
Trend Analysis:
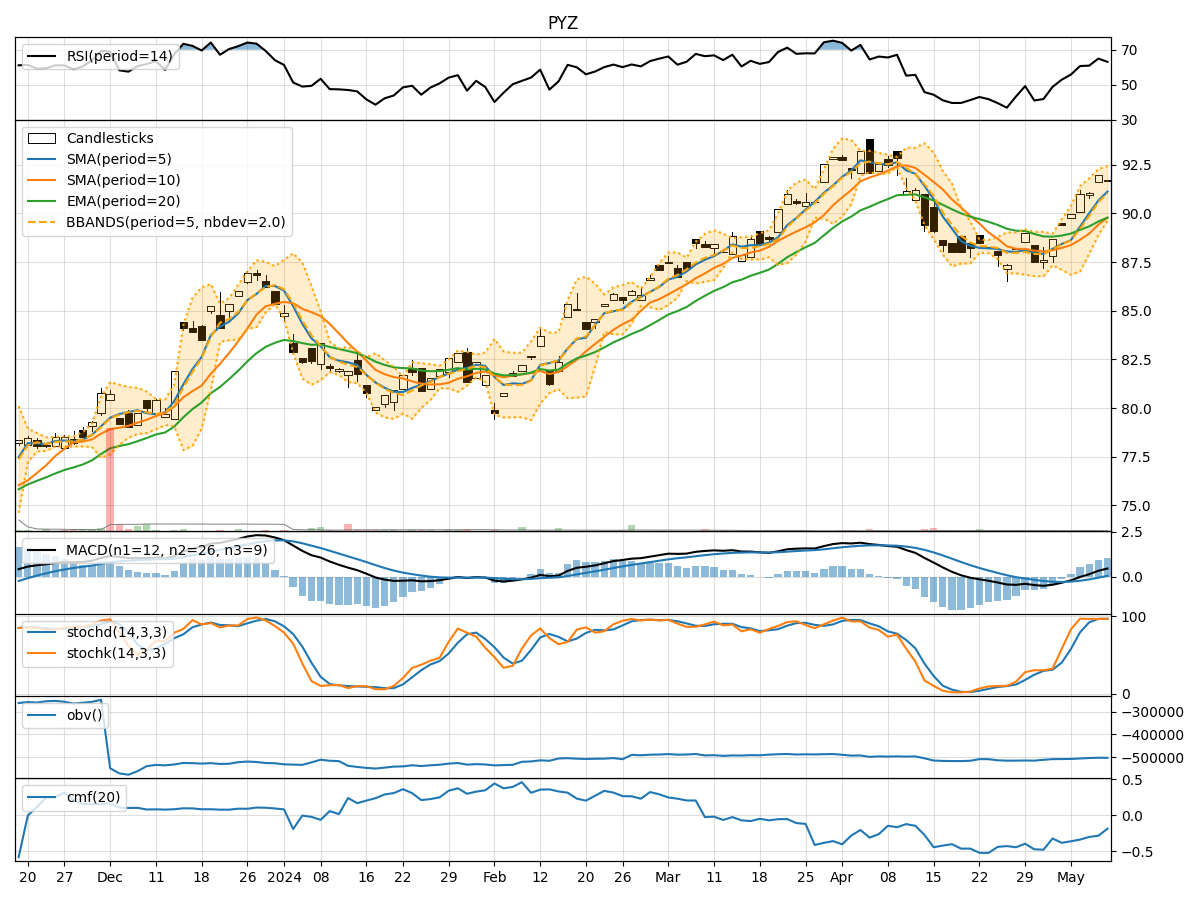
- Moving Averages (MA): The 5-day Moving Average (MA) has been fluctuating around the closing prices, indicating a short-term trend. The Simple Moving Average (SMA) and Exponential Moving Average (EMA) have shown slight variations but have generally followed the price movements.
- MACD: The Moving Average Convergence Divergence (MACD) has been positive but with decreasing values, suggesting a potential slowdown in the bullish momentum.
- MACD Histogram: The MACD Histogram has been declining, indicating a decrease in the bullish momentum.
Momentum Analysis:
- RSI: The Relative Strength Index (RSI) has been fluctuating around the mid-level, indicating a lack of strong momentum in either direction.
- Stochastic Oscillator: Both %K and %D of the Stochastic Oscillator have been in the oversold region, suggesting a potential reversal in the short term.
- Williams %R: The Williams %R has been fluctuating in the oversold region, indicating a possible buying opportunity.
Volatility Analysis:
- Bollinger Bands (BB): The Bollinger Bands have been narrowing, suggesting a decrease in volatility and a potential period of consolidation.
- Bollinger Band %B: The %B indicator has been hovering around the mid-level, indicating a balanced market sentiment.
- Bollinger Band Width: The Band Width has been decreasing, signaling a contraction in volatility.
Volume Analysis:
- On-Balance Volume (OBV): The OBV has shown mixed signals with alternating positive and negative values, indicating indecision among market participants.
- Chaikin Money Flow (CMF): The CMF has been negative, suggesting a net outflow of money from the stock.
Key Observations and Opinions:
- Trend: The trend indicators suggest a potential slowdown in the bullish momentum, with the MACD and MACD Histogram showing signs of weakening.
- Momentum: The momentum indicators indicate a lack of strong directional momentum, with the Stochastic Oscillator and Williams %R signaling a possible reversal.
- Volatility: The narrowing Bollinger Bands and decreasing Band Width point towards a period of consolidation and reduced volatility.
- Volume: The mixed signals from OBV and negative CMF indicate uncertainty and a lack of strong buying interest.
Conclusion:
Based on the analysis of the technical indicators, the stock price of PYZ is likely to experience sideways movement in the upcoming trading days. The weakening trend indicators, lack of strong momentum, consolidation in volatility, and mixed volume signals suggest a period of indecision and potential range-bound trading. Traders should exercise caution and wait for clearer signals before taking significant positions.