Technical Analysis of QDEC 2024-05-31
Overview:
In analyzing the technical indicators for the stock QDEC over the last 5 days, we will delve into the trends, momentum, volatility, and volume indicators to provide a comprehensive outlook on the possible stock price movement in the coming days. By examining these key aspects, we aim to offer valuable insights and recommendations for potential investors.
Trend Analysis:
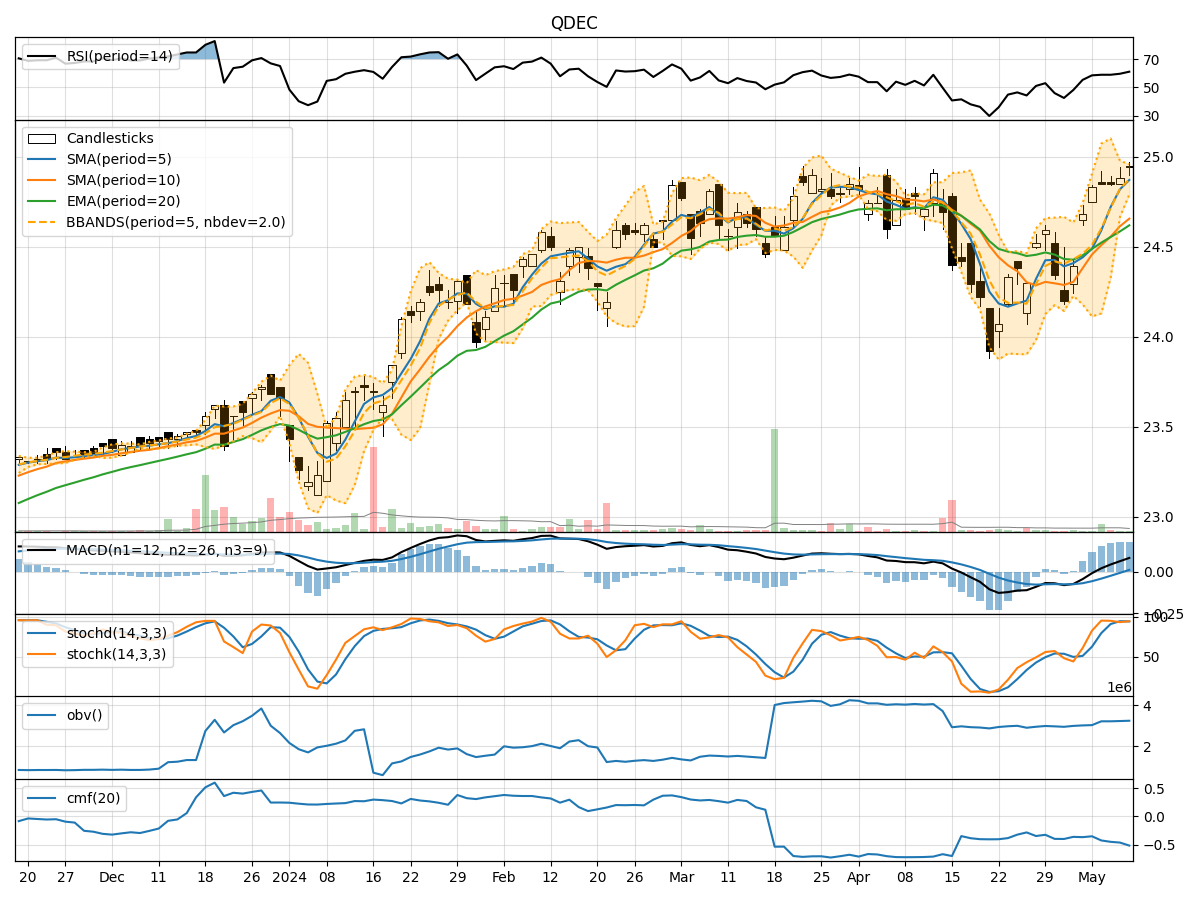
- Moving Averages (MA): The 5-day Moving Average (MA) has been relatively stable around the closing prices, indicating a consistent trend.
- MACD and Signal Line: The MACD line has been positive, suggesting a bullish momentum in the short term.
- Relative Strength Index (RSI): The RSI values have been fluctuating but generally staying within the neutral to overbought territory.
Momentum Analysis:
- Stochastic Oscillator: The Stochastic Oscillator has shown a decline in values, moving from overbought to oversold levels, indicating a potential reversal in momentum.
- Williams %R (Willr): The Williams %R values have been fluctuating but are currently in the oversold territory, suggesting a possible buying opportunity.
Volatility Analysis:
- Bollinger Bands (BB): The Bollinger Bands have shown narrowing bands, indicating decreasing volatility and a potential price breakout.
- Bollinger Band %B (bbp): The %B values have been fluctuating but are currently indicating a potential buying opportunity as the price is near the lower band.
Volume Analysis:
- On-Balance Volume (OBV): The OBV values have been fluctuating but have not shown a clear trend, indicating mixed sentiment among investors.
- Chaikin Money Flow (CMF): The CMF values have been negative, suggesting a bearish sentiment in the market.
Conclusion:
Based on the analysis of the technical indicators, the stock QDEC is likely to experience sideways consolidation in the coming days. The decreasing volatility, mixed volume sentiment, and potential reversal in momentum indicate a period of indecision in the market. Investors should exercise caution and wait for clearer signals before making significant trading decisions.