Technical Analysis of QMOM 2024-05-31
Overview:
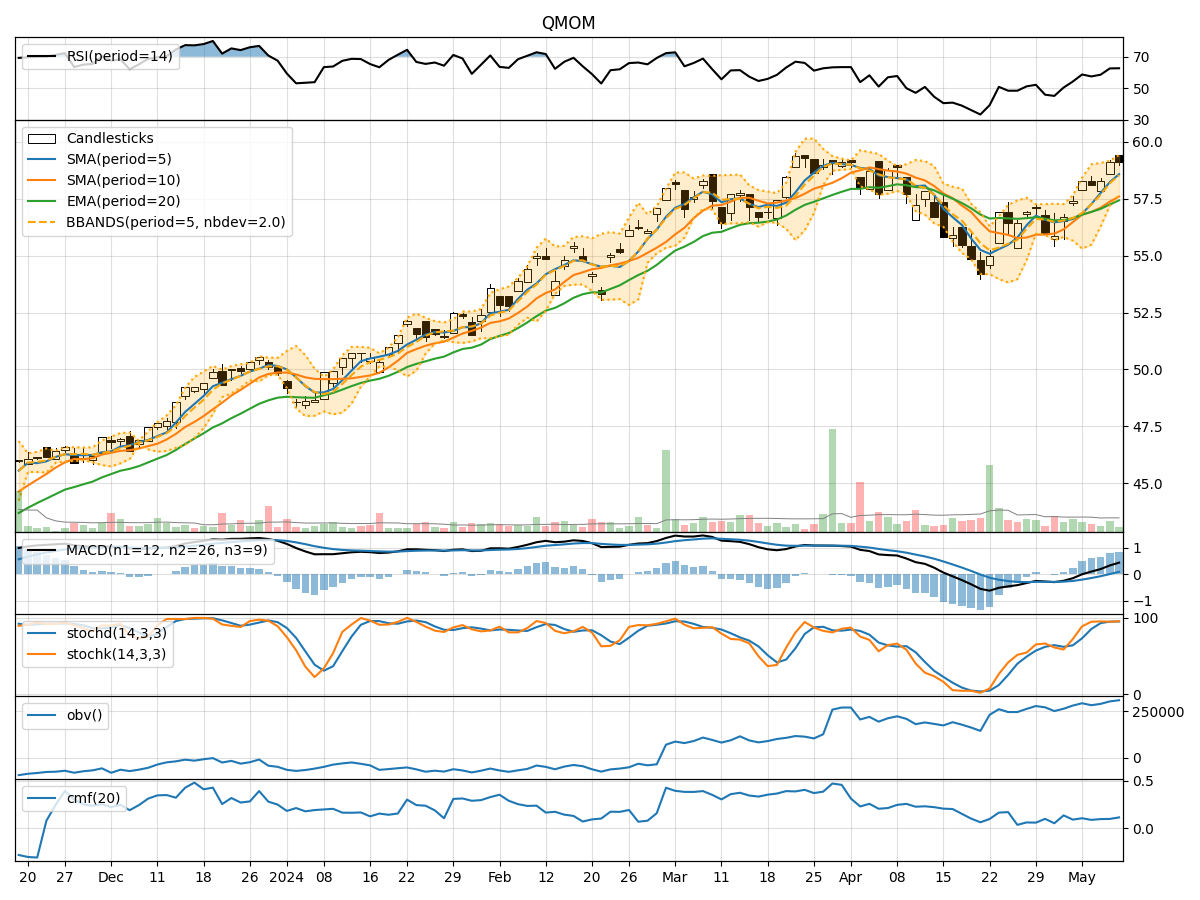
In the last 5 trading days, the stock price of QMOM has shown a slight decline from 60.60 to 59.11. Various technical indicators have been analyzed to provide insights into the possible future movement of the stock price. The analysis covers trend indicators, momentum indicators, volatility indicators, and volume indicators.
Trend Indicators Analysis:
- Moving Averages (MA): The 5-day Moving Average (MA) has been slightly below the Simple Moving Average (SMA) and Exponential Moving Average (EMA) consistently, indicating a short-term bearish trend.
- MACD: The MACD line has been decreasing, and the MACD Histogram has been negative, suggesting a weakening bullish momentum.
- Conclusion: The trend indicators point towards a downward trend in the stock price.
Momentum Indicators Analysis:
- RSI: The Relative Strength Index (RSI) has been declining, indicating a decrease in buying pressure.
- Stochastic Oscillator: Both %K and %D have been decreasing, showing a loss in momentum.
- Williams %R: The Williams %R has been in the oversold territory, suggesting a potential reversal.
- Conclusion: Momentum indicators suggest a bearish sentiment in the stock.
Volatility Indicators Analysis:
- Bollinger Bands (BB): The stock price has been trading within the bands, with the bands narrowing, indicating decreasing volatility.
- Conclusion: Volatility indicators signal a sideways movement or consolidation in the stock price.
Volume Indicators Analysis:
- On-Balance Volume (OBV): The OBV has been declining, indicating selling pressure.
- Chaikin Money Flow (CMF): The CMF has been fluctuating but overall showing a slight positive trend.
- Conclusion: Volume indicators suggest a bearish sentiment in the stock.
Conclusion:
Based on the analysis of trend, momentum, volatility, and volume indicators, the overall outlook for QMOM stock in the next few days is bearish. The trend indicators indicate a downward trend, momentum indicators show a bearish sentiment, and volume indicators suggest selling pressure. Although volatility indicators signal a sideways movement, the overall picture points towards a potential further decline in the stock price.
Recommendation:
Considering the bearish outlook, investors may consider short-term selling strategies or wait for a reversal confirmation before considering long positions. It is essential to monitor key support levels and wait for a potential trend reversal confirmation before making any investment decisions.