Technical Analysis of QSML 2024-05-31
Overview:
In analyzing the technical indicators for QSML over the last 5 days, we will delve into the trend, momentum, volatility, and volume indicators to provide a comprehensive outlook on the possible stock price movement. By examining these key factors, we aim to offer valuable insights and predictions for the upcoming days.
Trend Analysis:
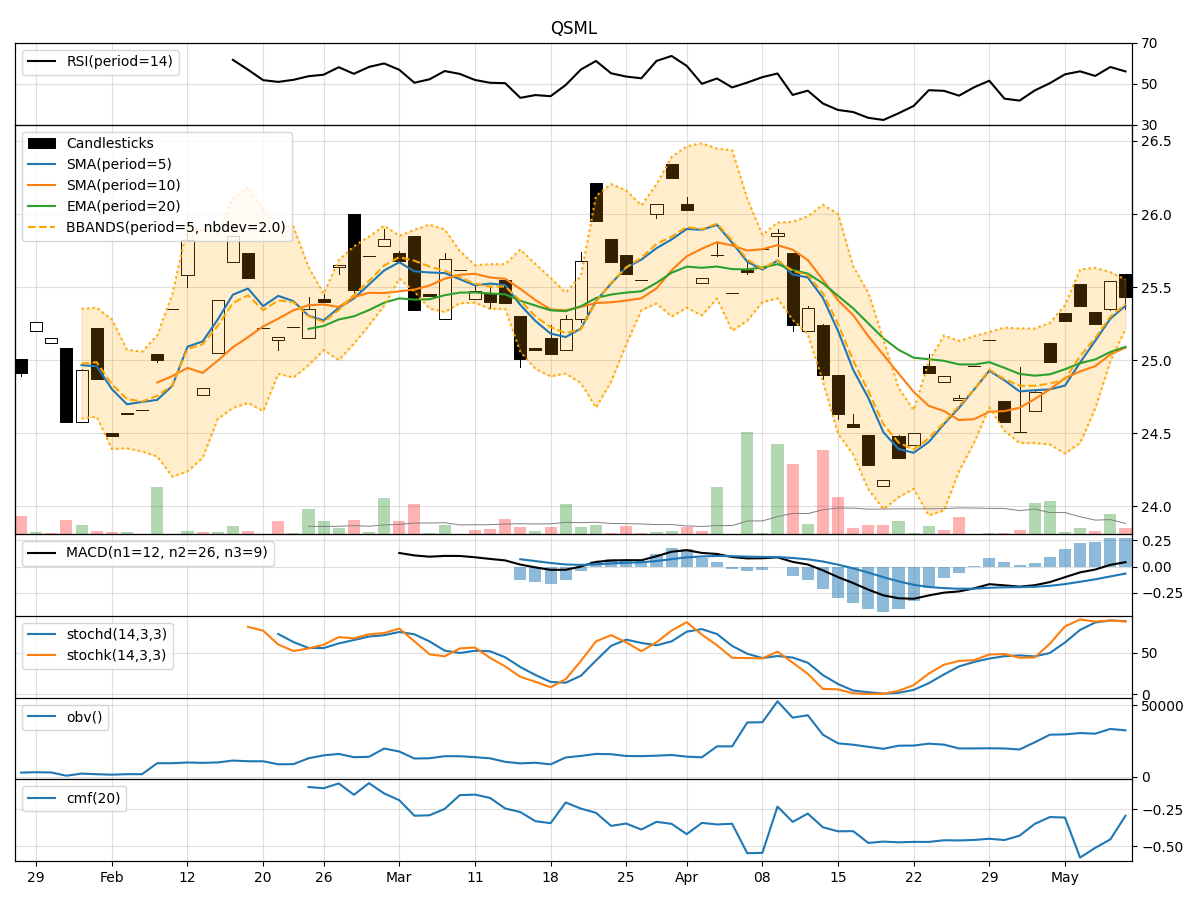
- Moving Averages (MA): The 5-day MA has been fluctuating around the closing prices, indicating short-term price trends. The SMA(10) and EMA(20) have shown slight variations but have not diverged significantly.
- MACD: The MACD line has been positive, indicating a bullish trend, although the MACD Histogram has shown some decrease in momentum over the past few days.
Momentum Analysis:
- RSI: The RSI has been hovering around the mid-range, suggesting a neutral momentum in the stock.
- Stochastic Oscillator: Both %K and %D have been fluctuating, indicating indecision in momentum.
- Williams %R: The Williams %R has shown oversold conditions, suggesting a potential reversal in momentum.
Volatility Analysis:
- Bollinger Bands: The stock price has been trading within the Bollinger Bands, with the bands narrowing slightly, indicating reduced volatility.
- Bollinger %B: The %B indicator has been fluctuating within the bands, reflecting the price's position relative to the bands.
Volume Analysis:
- On-Balance Volume (OBV): The OBV has been relatively stable, indicating a balance between buying and selling pressure.
- Chaikin Money Flow (CMF): The CMF has been negative, suggesting outflow of money from the stock.
Key Observations:
- The trend indicators show a mixed picture with a slight bullish bias.
- Momentum indicators suggest a lack of clear direction in the stock's momentum.
- Volatility has been decreasing, indicating a potential consolidation phase.
- Volume indicators reflect a balance between buying and selling pressure.
Conclusion:
Based on the analysis of the technical indicators, the stock price of QSML is likely to experience sideways movement in the next few days. The lack of strong momentum, coupled with decreasing volatility and balanced volume, suggests a period of consolidation. Traders may expect the stock to trade within a narrow range without a clear trend direction. It is advisable to closely monitor key support and resistance levels for potential breakout opportunities.