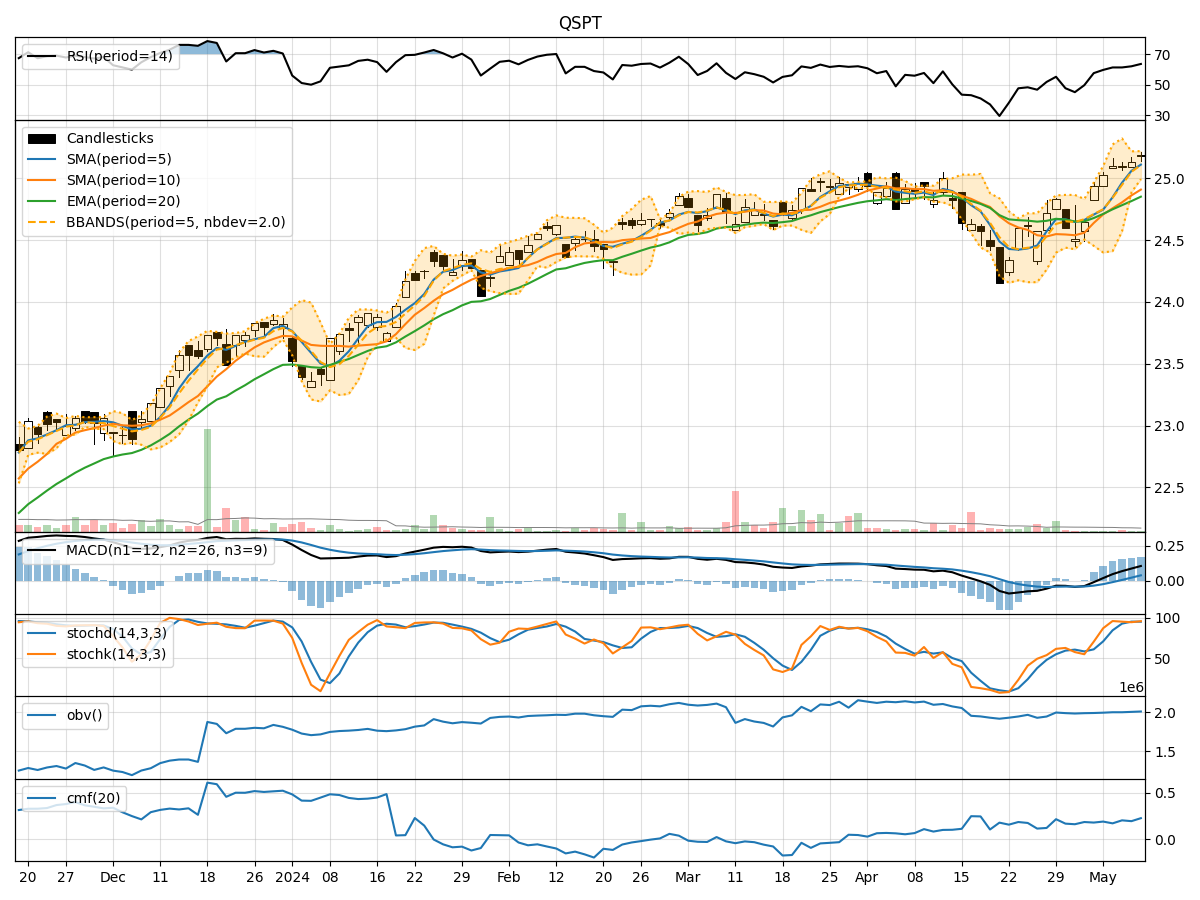
Technical Analysis of QSPT 2024-05-31
Overview:
In analyzing the technical indicators for QSPT over the last 5 days, we will delve into the trend, momentum, volatility, and volume indicators to provide a comprehensive outlook on the possible stock price movement in the coming days. By examining these key aspects, we aim to offer valuable insights and predictions to guide your investment decisions.
Trend Analysis:
- Moving Averages (MA): The 5-day Moving Average (MA) has been relatively stable around the current stock price, indicating a neutral trend.
- MACD: The Moving Average Convergence Divergence (MACD) shows a slight positive trend, with the MACD line consistently above the signal line.
- EMA: The Exponential Moving Average (EMA) has been gradually increasing, suggesting a bullish sentiment in the short term.
Momentum Analysis:
- RSI: The Relative Strength Index (RSI) has been fluctuating but remains in the neutral zone, indicating balanced buying and selling pressure.
- Stochastic Oscillator: Both %K and %D values have been declining, signaling a potential bearish momentum.
- Williams %R: The Williams %R indicator shows an oversold condition, suggesting a possible reversal in the near future.
Volatility Analysis:
- Bollinger Bands: The Bollinger Bands are narrowing, indicating decreasing volatility and a potential period of consolidation.
- Bollinger %B: The %B indicator is hovering around the midline, reflecting a balanced market sentiment.
Volume Analysis:
- On-Balance Volume (OBV): The OBV has been fluctuating, indicating mixed buying and selling pressure.
- Chaikin Money Flow (CMF): The CMF has been relatively stable, suggesting a neutral sentiment regarding money flow.
Key Observations:
- The trend indicators suggest a slightly bullish sentiment in the short term.
- Momentum indicators show a mixed picture with a potential bearish bias.
- Volatility is decreasing, indicating a period of consolidation.
- Volume indicators reflect a balanced buying and selling pressure.
Conclusion:
Based on the analysis of the technical indicators, the stock price of QSPT is likely to experience sideways movement in the coming days. While there are indications of a bullish trend in the short term, the momentum and volume indicators suggest a mixed sentiment with a potential bearish bias. The decreasing volatility points towards a period of consolidation, where the stock price may trade within a narrow range. It is advisable to closely monitor key support and resistance levels for potential breakout opportunities.