Technical Analysis of RDOG 2024-05-31
Overview:
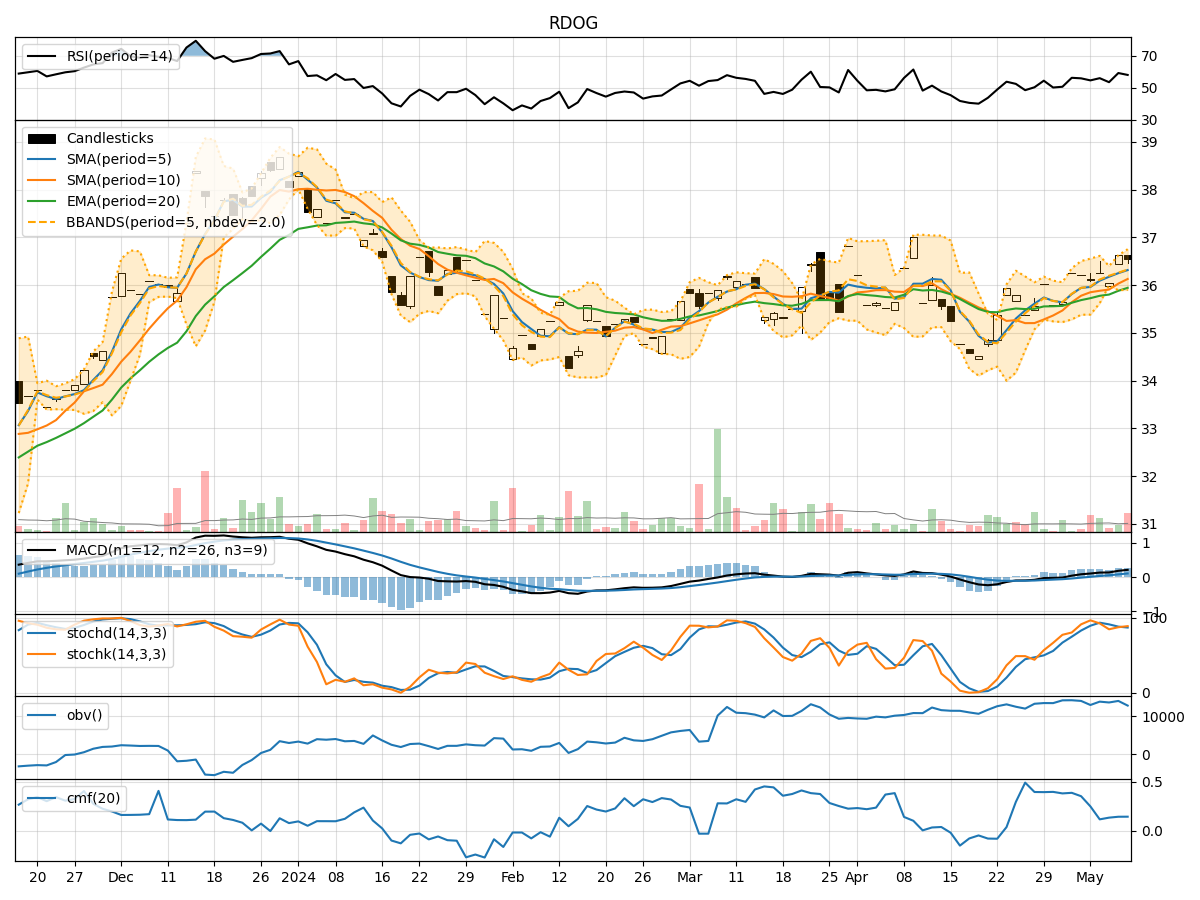
In analyzing the technical indicators for RDOG over the last 5 days, we will delve into the trend, momentum, volatility, and volume indicators to provide a comprehensive outlook on the possible stock price movement in the coming days. By examining these key aspects, we aim to offer valuable insights and recommendations for potential investors.
Trend Analysis:
- Moving Averages (MA): The 5-day MA has been consistently below the closing prices, indicating a short-term downtrend.
- MACD: The MACD line has been below the signal line, suggesting a bearish momentum.
Key Observation: The trend indicators point towards a bearish sentiment in the short term.
Momentum Analysis:
- RSI: The RSI values have been fluctuating but are currently above 50, indicating a neutral to slightly bullish momentum.
- Stochastic Oscillator: Both %K and %D values have been relatively low, signaling a potential oversold condition.
Key Observation: The momentum indicators suggest a neutral to slightly bullish sentiment.
Volatility Analysis:
- Bollinger Bands (BB): The stock price has been trading within the bands, with the %B indicator hovering around 0.5, indicating a balanced volatility.
Key Observation: Volatility remains stable with no significant spikes.
Volume Analysis:
- On-Balance Volume (OBV): The OBV values have been fluctuating, indicating mixed buying and selling pressure.
- Chaikin Money Flow (CMF): The CMF values have been negative, suggesting a net outflow of money from the stock.
Key Observation: Volume indicators reflect mixed sentiment with a slight bearish bias.
Conclusion:
Based on the analysis of the technical indicators, the stock is likely to experience sideways movement in the coming days, with a slightly bearish bias in the short term. Investors should exercise caution and closely monitor the price action for any potential breakout or reversal signals. It is advisable to wait for more clarity in the market dynamics before making significant trading decisions.
Key Recommendations:
- Monitor Price Action: Keep a close eye on the stock's price movements for any signs of a trend reversal.
- Consider Risk Management: Implement appropriate risk management strategies to protect your investments in a volatile market.
- Wait for Confirmation: Wait for confirmation from multiple indicators before making trading decisions to reduce the risk of false signals.
In conclusion, while the technical indicators suggest a mixed sentiment with a slight bearish bias, it is essential to remain vigilant and adapt to changing market conditions. Conducting further analysis and staying informed about relevant news and events can help in making well-informed investment decisions.