Technical Analysis of RFCI 2024-05-31
Overview:
In the last 5 trading days, RFCI stock has shown mixed signals across various technical indicators. The stock's price has been fluctuating within a narrow range, indicating indecision in the market. We will analyze the trend, momentum, volatility, and volume indicators to provide insights into the possible future price movement of RFCI stock.
Trend Indicators:
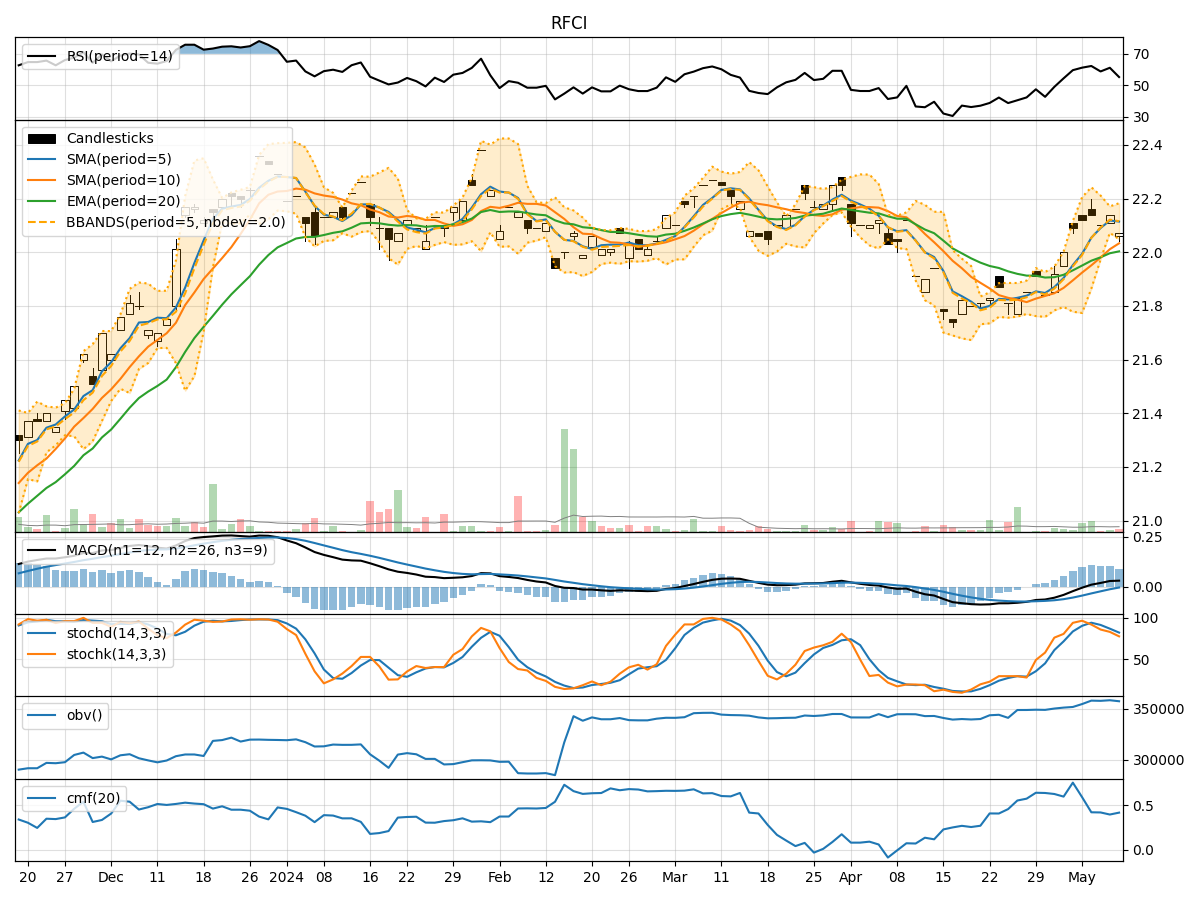
- Moving Averages (MA): The 5-day MA has been hovering around the closing price, indicating a short-term equilibrium. The SMA(10) and EMA(20) are relatively close to each other, suggesting stability in the medium to long term.
- MACD: The MACD line has been positive but decreasing, while the MACD Histogram has been moving towards the zero line. This indicates a potential weakening of the bullish momentum.
Momentum Indicators:
- RSI: The RSI has been fluctuating around the 50 level, indicating a lack of strong momentum in either direction.
- Stochastic Oscillator: Both %K and %D have been fluctuating in the neutral zone, suggesting a lack of clear trend direction.
- Williams %R: The Williams %R has been consistently in the oversold territory, indicating a potential reversal in the short term.
Volatility Indicators:
- Bollinger Bands: The stock price has been trading within the Bollinger Bands, with the bands narrowing, indicating reduced volatility.
- Bollinger %B: The %B indicator has been fluctuating around 0.5, suggesting a balanced market sentiment.
Volume Indicators:
- On-Balance Volume (OBV): The OBV has been relatively flat, indicating a balance between buying and selling pressure.
- Chaikin Money Flow (CMF): The CMF has been negative, indicating a slight outflow of money from the stock.
Key Observations and Opinions:
- Trend: The trend indicators suggest a neutral outlook with a slight bearish bias due to the weakening MACD momentum.
- Momentum: Momentum indicators show a lack of strong momentum in either direction, indicating a period of consolidation.
- Volatility: Volatility has been decreasing, suggesting a potential period of consolidation or range-bound trading.
- Volume: Volume indicators show a lack of significant buying or selling pressure, indicating a balanced market sentiment.
Conclusion:
Based on the analysis of the technical indicators, RFCI stock is likely to continue trading in a sideways pattern in the next few days. The lack of strong trend direction, coupled with decreasing volatility and neutral volume indicators, suggests a period of consolidation. Traders may expect the stock price to remain range-bound until a clear catalyst emerges to drive a decisive move. It is advisable to closely monitor key support and resistance levels for potential breakout or breakdown signals.