Technical Analysis of RISR 2024-05-31
Overview:
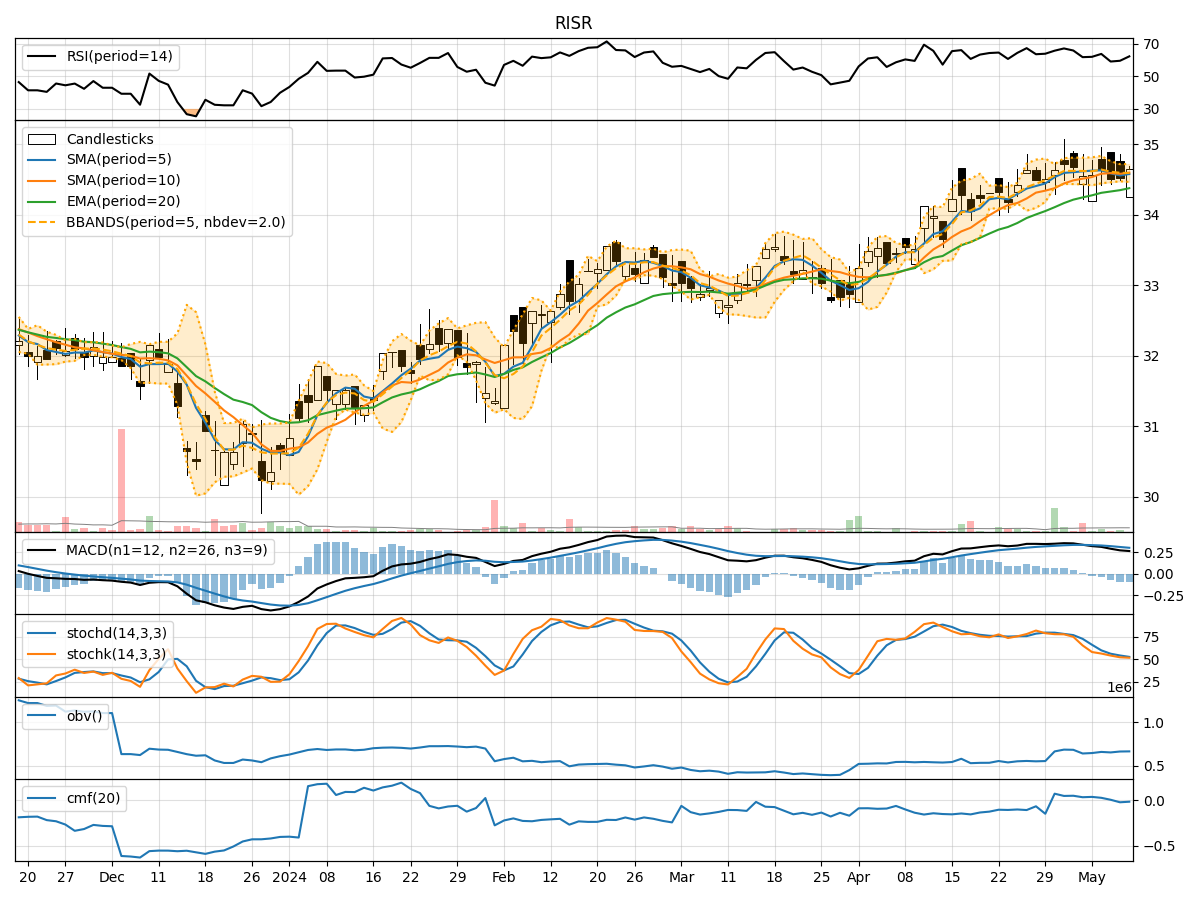
In analyzing the provided RISR TA data for the last 5 days, we will delve into the technical indicators across trend, momentum, volatility, and volume to derive insights into the possible future stock price movement. By examining these indicators comprehensively, we aim to provide a well-informed prediction for the upcoming days.
Trend Indicators:
- Moving Averages (MA): The 5-day MA has been showing an upward trend, indicating a positive momentum in the stock price.
- MACD: The MACD line has been consistently above the signal line, suggesting a bullish trend.
- RSI: The RSI value has been fluctuating but generally staying within the neutral to slightly overbought territory.
Key Observation: The trend indicators point towards a bullish sentiment in the stock price movement.
Momentum Indicators:
- RSI: The RSI has been showing some volatility but has not reached extreme levels, indicating a balanced momentum.
- Stochastic Oscillator: Both %K and %D values have been in the overbought zone, suggesting a potential reversal or consolidation.
- Williams %R: The Williams %R has been fluctuating but has not reached extreme levels, indicating a neutral momentum.
Key Observation: Momentum indicators suggest a potential consolidation or minor pullback in the stock price.
Volatility Indicators:
- Bollinger Bands: The stock price has been trading within the bands, indicating moderate volatility.
- Average True Range (ATR): The ATR value has been relatively stable, suggesting consistent volatility levels.
Key Observation: Volatility indicators imply a stable price movement with no significant spikes expected.
Volume Indicators:
- On-Balance Volume (OBV): The OBV has been increasing, indicating accumulation of the stock.
- Chaikin Money Flow (CMF): The CMF has been positive, suggesting buying pressure in the stock.
Key Observation: Volume indicators signal a positive sentiment with increasing accumulation and buying pressure.
Conclusion:
Based on the analysis of the technical indicators, the stock is likely to experience sideways consolidation in the upcoming days. The trend indicators support a bullish view, while momentum indicators hint at a potential consolidation or minor pullback. Volatility indicators suggest stable price movement, and volume indicators indicate positive accumulation and buying pressure.
Therefore, the next few days are expected to see the stock price trading within a narrow range with a slight bias towards the upside. Investors may consider monitoring key support and resistance levels for potential entry or exit points in line with the overall market sentiment and risk tolerance.