Technical Analysis of ROSC 2024-05-31
Overview:
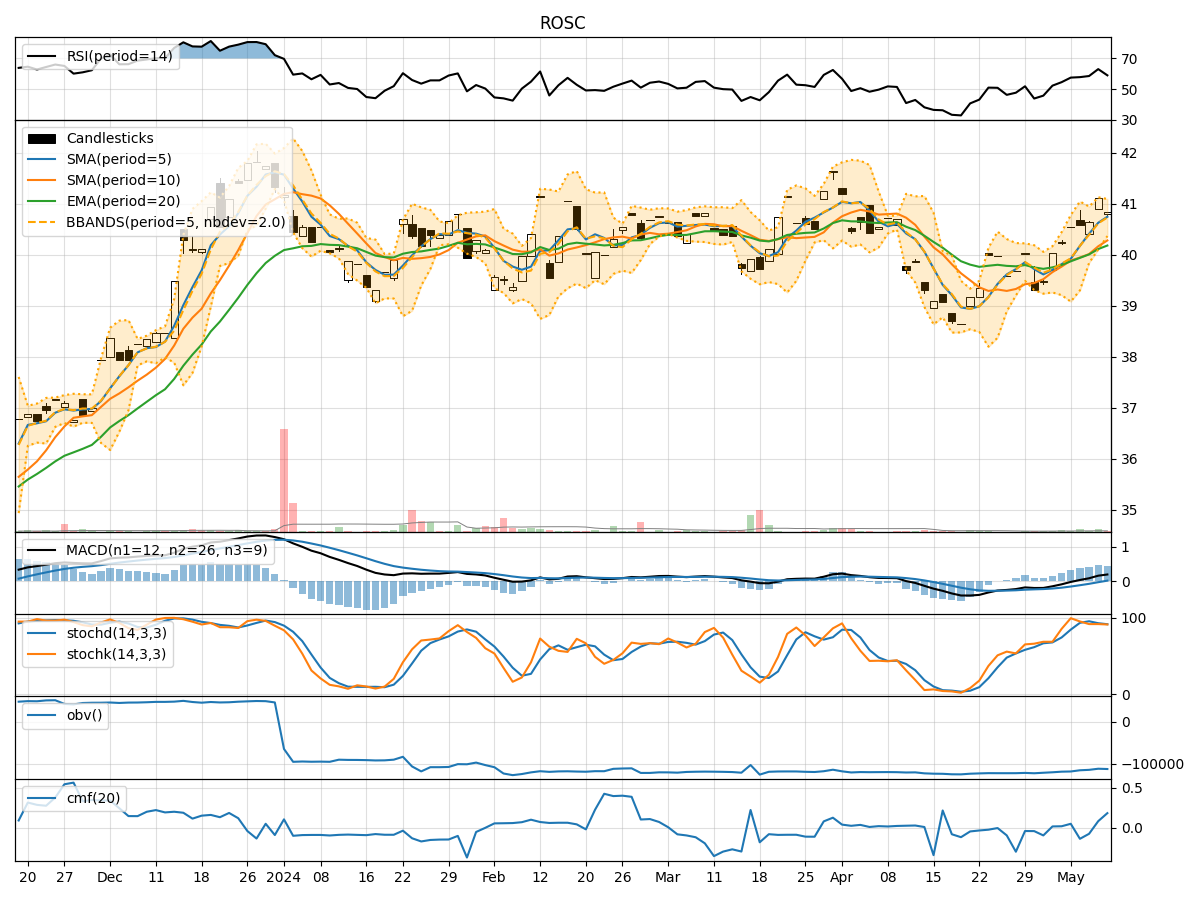
In analyzing the provided ROSC TA data for the last 5 days, we will delve into various technical indicators across trend, momentum, volatility, and volume categories to determine the possible stock price movement in the upcoming days. By examining these indicators, we aim to provide a comprehensive and insightful analysis to guide potential trading decisions.
Trend Indicators:
- Moving Averages (MA): The 5-day MA has been slightly below the SMA(10) and EMA(20) in the last few days, indicating a short-term bearish trend.
- MACD: The MACD line has been consistently below the signal line, suggesting a bearish momentum in the stock price.
- RSI: The RSI has been fluctuating around the neutral zone, indicating indecision in the market sentiment.
Momentum Indicators:
- Stochastic Oscillator: Both %K and %D have been relatively low, indicating a potential oversold condition in the stock.
- Williams %R: The Williams %R has been hovering in the oversold territory, signaling a possible reversal in the stock price.
Volatility Indicators:
- Bollinger Bands: The stock price has been trading within the Bollinger Bands, suggesting a period of consolidation and potential breakout in the near future.
- Average True Range (ATR): The ATR has been relatively stable, indicating consistent price movement without significant volatility spikes.
Volume Indicators:
- On-Balance Volume (OBV): The OBV has shown a slight decrease, indicating a potential distribution phase in the stock.
- Chaikin Money Flow (CMF): The CMF has been negative, suggesting selling pressure in the stock.
Key Observations:
- The stock is currently in a consolidation phase, as indicated by the trading within the Bollinger Bands and stable ATR.
- Momentum indicators suggest a potential oversold condition, which could lead to a reversal in the stock price.
- Volume indicators show a slight decrease in buying pressure, indicating a possible shift in market sentiment.
Conclusion:
Based on the analysis of the technical indicators, the stock is likely to experience sideways movement in the next few days, with a potential bullish reversal in the short term due to the oversold conditions indicated by momentum indicators. Traders should closely monitor the price action for a breakout from the consolidation phase and consider entering long positions once a clear uptrend is established. It is essential to set stop-loss levels to manage risk effectively in case of unexpected price movements.