Technical Analysis of RPV 2024-05-31
Overview:
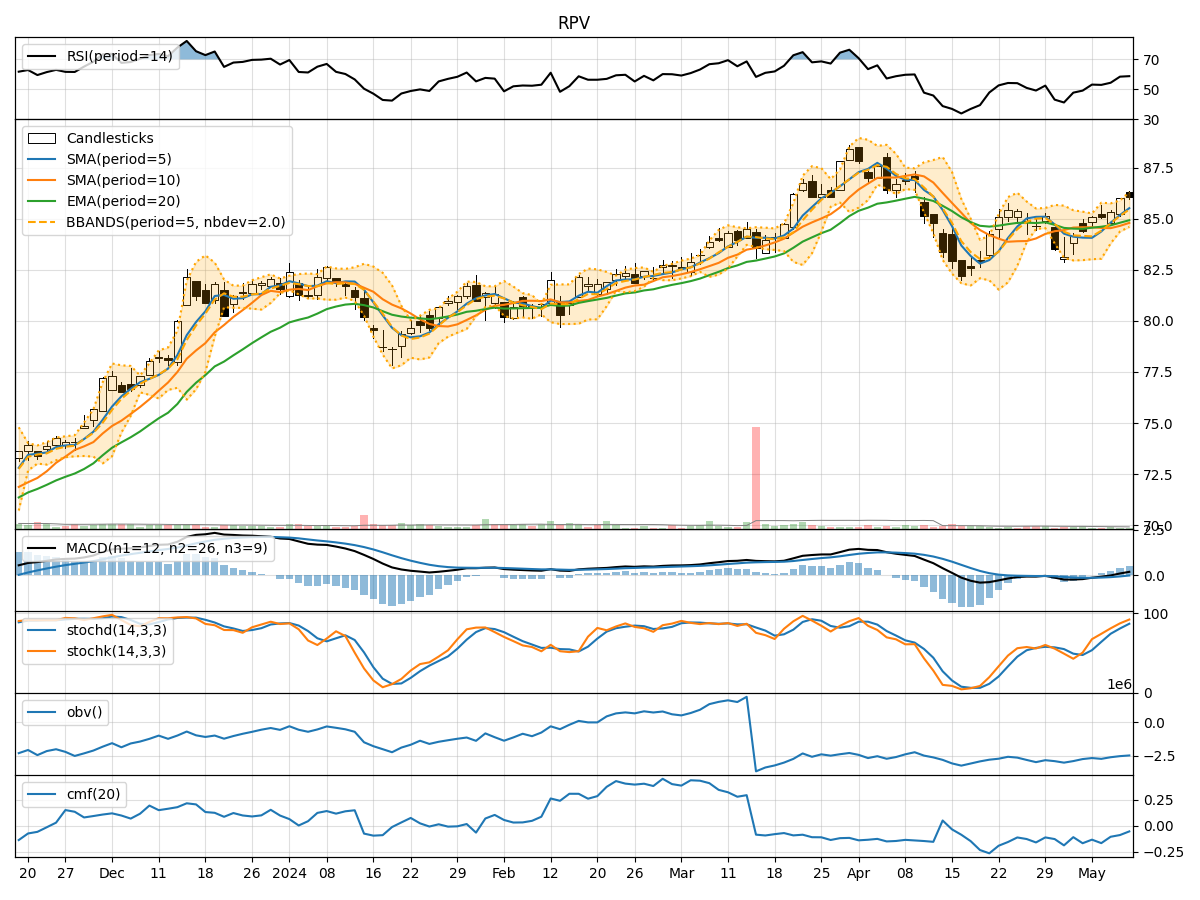
In analyzing the technical indicators for RPV stock over the last 5 days, we will delve into the trend, momentum, volatility, and volume indicators to provide a comprehensive outlook on the possible stock price movement in the coming days.
Trend Analysis:
- Moving Averages (MA): The 5-day Moving Average (MA) has been consistently below the Simple Moving Average (SMA) and Exponential Moving Average (EMA), indicating a downward trend.
- MACD: The MACD line has been below the signal line, with the MACD Histogram also showing negative values, suggesting bearish momentum.
Momentum Analysis:
- RSI: The Relative Strength Index (RSI) has been fluctuating in the oversold region, indicating a potential reversal or consolidation.
- Stochastic Oscillator: Both %K and %D have been in the oversold territory, signaling a possible reversal in the near future.
Volatility Analysis:
- Bollinger Bands (BB): The stock price has been consistently trading below the middle Bollinger Band (BBM), indicating a lower volatility period.
- Bollinger Band %B: The %B value has been below 1, suggesting that the stock is trading below the lower Bollinger Band, indicating a potential oversold condition.
Volume Analysis:
- On-Balance Volume (OBV): The OBV has been decreasing over the last 5 days, indicating selling pressure in the stock.
- Chaikin Money Flow (CMF): The CMF has been negative, reflecting a lack of buying interest in the stock.
Conclusion:
Based on the analysis of the technical indicators, the RPV stock is currently in a bearish trend with downward momentum. The stock is likely to experience further downside movement in the coming days. The oversold conditions in the RSI and Stochastic Oscillator may lead to a short-term consolidation or a minor pullback, but the overall trend remains bearish.
Key Conclusion: The stock is expected to continue its downward trajectory in the near term. Downward movement is anticipated based on the technical indicators analyzed.
It is crucial for investors to exercise caution and consider risk management strategies in such market conditions. Monitoring key support levels and potential reversal signals will be essential for making informed trading decisions.