Technical Analysis of SEF 2024-05-31
Overview:
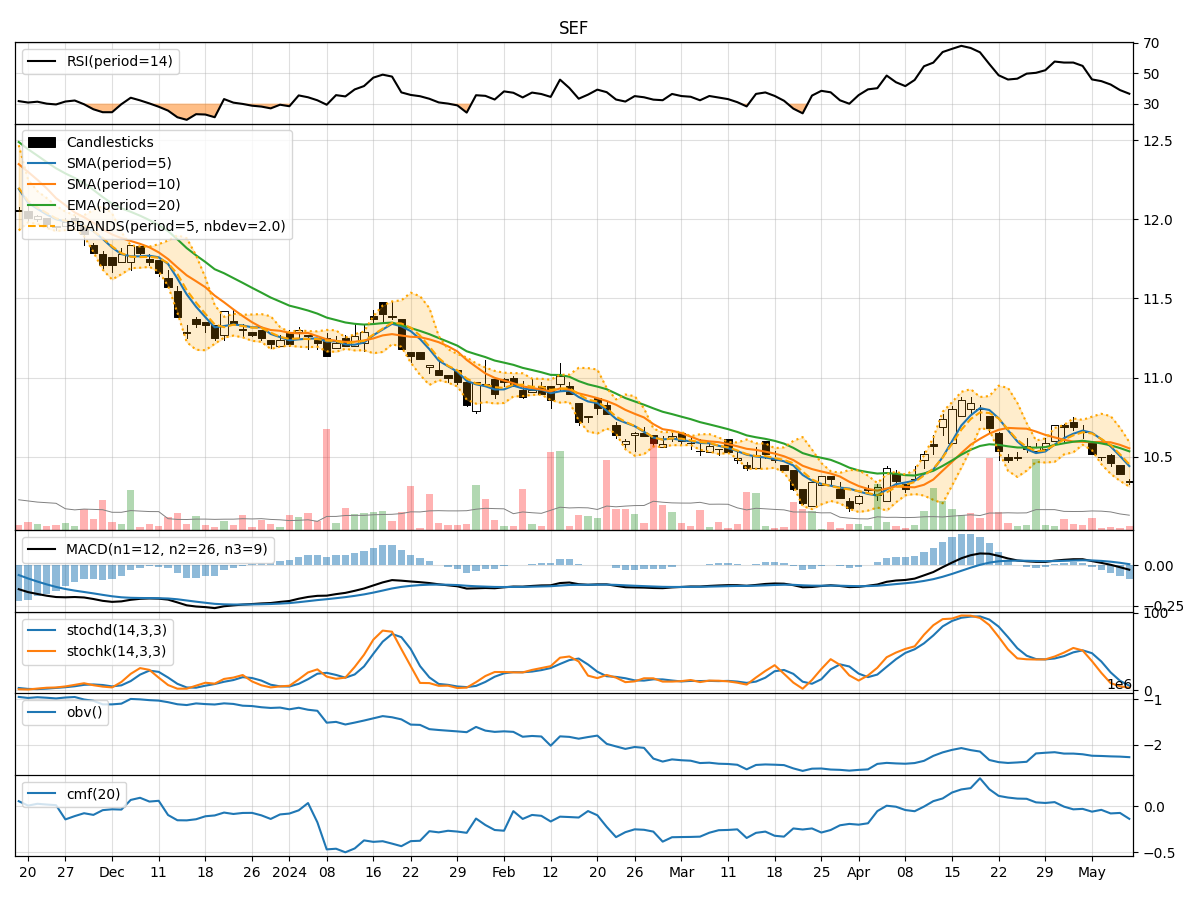
In analyzing the technical indicators for SEF stock over the last 5 days, we will delve into the trends, momentum, volatility, and volume indicators to provide a comprehensive outlook on the possible stock price movement in the coming days. By examining these key indicators, we aim to offer valuable insights and predictions for potential investors.
Trend Analysis:
- Moving Averages (MA): The 5-day Moving Average (MA) has been showing an upward trend, indicating a positive momentum in the stock price.
- MACD: The Moving Average Convergence Divergence (MACD) has been consistently positive, suggesting a bullish trend in the stock.
- EMA: The Exponential Moving Average (EMA) has been steadily increasing, supporting the bullish sentiment in the stock.
Momentum Analysis:
- RSI: The Relative Strength Index (RSI) has been fluctuating around the neutral zone, indicating a balanced momentum in the stock.
- Stochastic Oscillator: The Stochastic Oscillator has shown periods of overbought and oversold conditions, reflecting volatility in the stock price momentum.
Volatility Analysis:
- Bollinger Bands: The Bollinger Bands have shown fluctuations in the stock price volatility, with the bands widening and narrowing over the past few days.
- Volatility Percentage (BBP): The Bollinger Bands Percentage (BBP) has been fluctuating, indicating varying levels of volatility in the stock.
Volume Analysis:
- On-Balance Volume (OBV): The On-Balance Volume has shown mixed signals, with fluctuations in the volume traded, suggesting indecision among investors.
- Chaikin Money Flow (CMF): The Chaikin Money Flow has been negative, indicating selling pressure in the stock.
Key Observations:
- The trend indicators suggest a bullish sentiment in the stock, supported by positive moving averages and MACD.
- Momentum indicators show mixed signals, with RSI hovering around the neutral zone and stochastic oscillating between overbought and oversold levels.
- Volatility indicators indicate fluctuations in price volatility, with the Bollinger Bands widening and narrowing.
- Volume indicators reflect indecision among investors, with OBV showing mixed signals and CMF indicating selling pressure.
Conclusion:
Based on the analysis of the technical indicators, the stock is likely to continue its upward trend in the coming days. The bullish sentiment supported by the positive trend indicators and MACD suggests a potential increase in the stock price. However, investors should remain cautious of the mixed signals in momentum and volume indicators, which could lead to short-term fluctuations. Overall, the outlook for SEF stock is bullish in the near term.