Technical Analysis of SETM 2024-05-31
Overview:
In analyzing the technical indicators for SETM over the last 5 days, we will delve into the trend, momentum, volatility, and volume indicators to provide a comprehensive outlook on the possible stock price movement in the coming days. By examining these key aspects, we aim to offer valuable insights and predictions to guide investment decisions.
Trend Analysis:
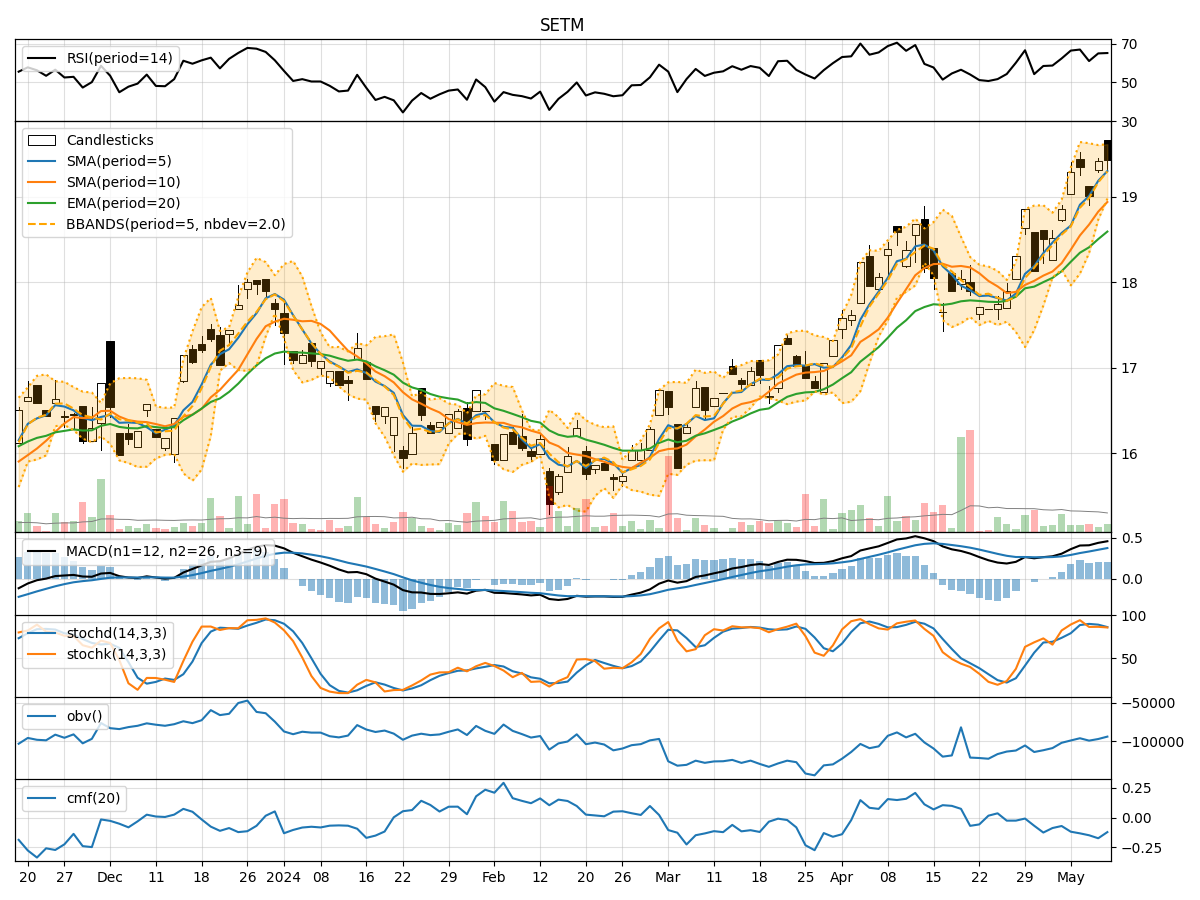
- Moving Averages (MA): The 5-day MA has been consistently below the closing price, indicating a short-term downtrend.
- MACD: The MACD line has been above the signal line, suggesting a bullish momentum.
- EMA: The EMA has been gradually increasing, reflecting a potential reversal in the downtrend.
Momentum Analysis:
- RSI: The RSI has been fluctuating around the neutral zone, indicating indecision in the market.
- Stochastic Oscillator: Both %K and %D have been declining, signaling a potential bearish momentum.
- Williams %R: The indicator has been in oversold territory, suggesting a possible reversal to the upside.
Volatility Analysis:
- Bollinger Bands (BB): The stock price has been trading within the bands, indicating a period of consolidation.
- Bollinger Band Width: The band width has been narrowing, suggesting a decrease in volatility.
- Bollinger Band %B: The %B indicator has been hovering around the middle, reflecting a balanced market sentiment.
Volume Analysis:
- On-Balance Volume (OBV): The OBV has been fluctuating, indicating mixed buying and selling pressure.
- Chaikin Money Flow (CMF): The CMF has been negative, suggesting a net outflow of money from the stock.
Conclusion:
Based on the analysis of the technical indicators, the stock of SETM is currently in a sideways consolidation phase with bearish momentum. The narrowing Bollinger Bands and declining Stochastic Oscillator point towards a lack of clear direction in the market. However, the bullish crossover in the MACD and the potential reversal indicated by the EMA signal a possible upward movement in the near future.
Considering the mixed signals from the indicators, investors should exercise caution and closely monitor the price action. A break above the upper Bollinger Band or a sustained increase in buying volume could confirm a bullish trend reversal. Conversely, a drop below the lower Bollinger Band or a further decline in momentum indicators could reinforce the bearish sentiment.
In conclusion, while the stock price of SETM may experience some near-term volatility, the overall outlook leans towards a potential upward movement in the coming days. Investors should remain vigilant and consider setting appropriate stop-loss levels to manage risk effectively.