Technical Analysis of SFLO 2024-05-31
Overview:
In analyzing the technical indicators for SFLO stock over the last 5 days, we will delve into the trends, momentum, volatility, and volume aspects to provide a comprehensive outlook on the possible stock price movement in the upcoming days. By examining key indicators such as moving averages, MACD, RSI, Bollinger Bands, and OBV, we aim to offer valuable insights and predictions for informed decision-making.
Trend Analysis:
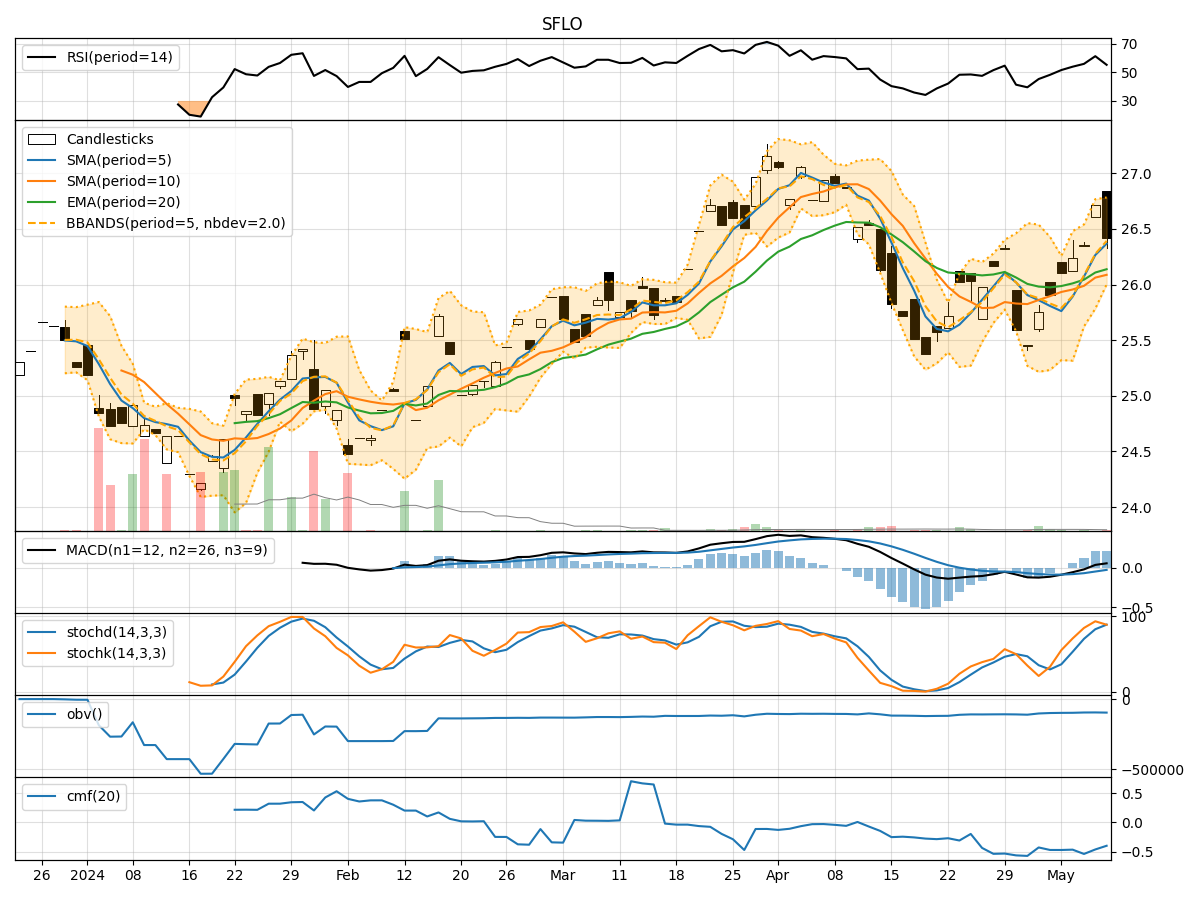
- Moving Averages (MA): The 5-day MA has been fluctuating around the closing prices, indicating short-term price trends. The SMA(10) and EMA(20) have shown slight variations but have not diverged significantly.
- MACD: The MACD line has been positive, indicating a bullish trend, although the MACD histogram has shown some decrease in momentum over the past few days.
Momentum Analysis:
- RSI: The RSI values have been hovering around the mid-range, suggesting a neutral momentum with no extreme overbought or oversold conditions.
- Stochastic Oscillator: Both %K and %D values have been fluctuating, indicating indecision in momentum direction.
- Williams %R: The Williams %R values have been mixed, with no clear indication of strong momentum either way.
Volatility Analysis:
- Bollinger Bands: The stock price has mostly stayed within the Bollinger Bands, with no significant breaches indicating extreme volatility.
- Bollinger Band %B: The %B values have remained relatively stable, suggesting a lack of significant price volatility.
Volume Analysis:
- On-Balance Volume (OBV): The OBV values have shown a slight increase, indicating some accumulation of the stock.
- Chaikin Money Flow (CMF): The CMF values have been negative, suggesting some selling pressure in the market.
Key Observations:
- The stock has been trading within a narrow range with no clear trend direction.
- Momentum indicators show mixed signals, reflecting indecision among traders.
- Volatility has been relatively low, indicating a lack of significant price swings.
- Volume indicators suggest a slight increase in buying interest but with overall negative money flow.
Conclusion:
Based on the analysis of the technical indicators, the stock is likely to continue trading sideways in the near term. The lack of clear trend direction, mixed momentum signals, low volatility, and negative money flow indicate a period of consolidation. Traders should exercise caution and wait for clearer signals before making significant trading decisions.