Technical Analysis of SMIZ 2024-05-31
Overview:
In analyzing the technical indicators for SMIZ over the last 5 days, we will delve into the trend, momentum, volatility, and volume indicators to provide a comprehensive outlook on the possible stock price movement in the coming days. By examining these key aspects, we aim to offer valuable insights and predictions for informed decision-making.
Trend Indicators:
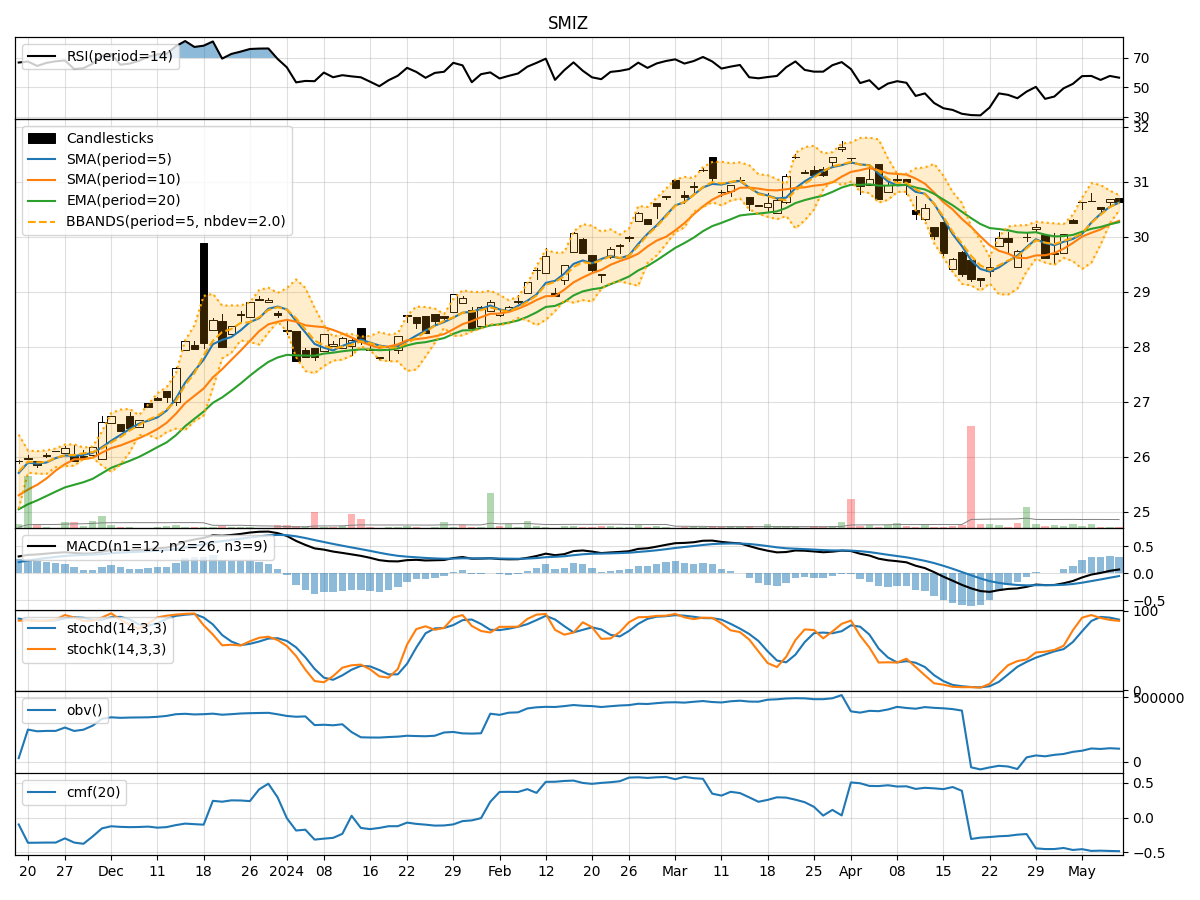
- Moving Averages (MA): The 5-day MA has been fluctuating around the closing prices, indicating short-term price trends. The SMA(10) and EMA(20) have shown slight declines, suggesting a weakening trend.
- MACD: The MACD line has been positive but decreasing, while the MACD Histogram has been consistently negative, signaling a potential bearish momentum.
Momentum Indicators:
- RSI: The RSI has been hovering around the mid-level, indicating a neutral stance in terms of momentum.
- Stochastic Oscillator: Both %K and %D have been relatively low, suggesting a lack of strong buying or selling pressure.
Volatility Indicators:
- Bollinger Bands (BB): The bands have been narrowing, indicating decreasing volatility and a potential period of consolidation.
Volume Indicators:
- On-Balance Volume (OBV): The OBV has shown a slight decline, suggesting some distribution of shares.
- Chaikin Money Flow (CMF): The CMF has been negative, indicating selling pressure in the market.
Key Observations:
- The trend indicators suggest a weakening trend with a bearish bias.
- Momentum indicators reflect a neutral stance with no clear direction in buying or selling pressure.
- Volatility indicators point towards decreasing volatility and a possible consolidation phase.
- Volume indicators indicate a slight distribution of shares and selling pressure in the market.
Conclusion:
Based on the analysis of the technical indicators, the outlook for SMIZ in the next few days is bearish. The weakening trend, negative momentum, decreasing volatility, and selling pressure indicated by the volume indicators all point towards a potential downward movement in the stock price. Traders and investors should exercise caution and consider short-term bearish strategies or wait for more clarity in the market before making significant investment decisions.