Technical Analysis of SMMV 2024-05-31
Overview:
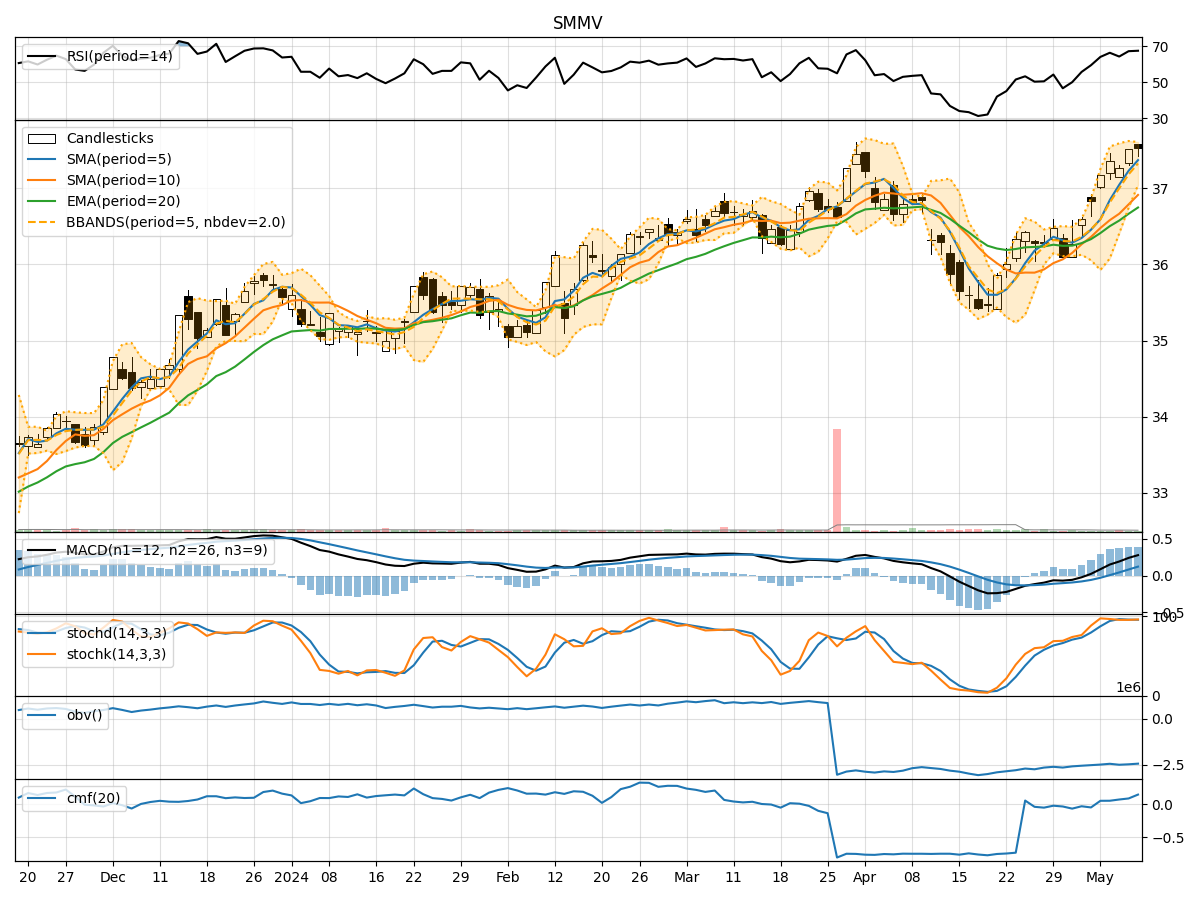
In analyzing the technical indicators for SMMV over the last 5 days, we will delve into the trend, momentum, volatility, and volume indicators to provide a comprehensive outlook on the possible stock price movement in the coming days.
Trend Analysis:
- Moving Averages (MA): The 5-day Moving Average (MA) has been fluctuating around the closing prices, indicating short-term price trends. The Simple Moving Average (SMA) and Exponential Moving Average (EMA) show a slight downward trend, with the EMA lagging behind.
- Moving Average Convergence Divergence (MACD): The MACD and Signal line have been converging towards each other, suggesting a potential reversal in trend.
Momentum Analysis:
- Relative Strength Index (RSI): The RSI has been oscillating around the 50 level, indicating a balanced momentum between buying and selling pressure.
- Stochastic Oscillator: Both %K and %D have been in the oversold region, hinting at a possible reversal in price direction.
- Williams %R (Willams %R): The Williams %R has been fluctuating in the oversold region, signaling a potential buying opportunity.
Volatility Analysis:
- Bollinger Bands (BB): The Bollinger Bands have been narrowing, suggesting decreasing volatility in the stock price.
- Bollinger Band %B (BB %B): The %B indicator has been hovering around the middle band, indicating a neutral stance in terms of volatility.
Volume Analysis:
- On-Balance Volume (OBV): The OBV has shown a slight decrease over the last 5 days, indicating a divergence between volume and price movement.
- Chaikin Money Flow (CMF): The CMF has been negative, reflecting selling pressure in the stock.
Key Observations and Opinions:
- Trend: The trend indicators show a potential reversal in the short-term trend, with the MACD converging and moving towards a bullish crossover.
- Momentum: The momentum indicators suggest a possible shift towards a buying opportunity as the stochastic and Williams %R indicate oversold conditions.
- Volatility: Volatility has been decreasing, which could lead to a period of consolidation or a breakout in the near future.
- Volume: The divergence between OBV and price movement, along with negative CMF, indicates a cautious sentiment among investors.
Conclusion:
Based on the analysis of the technical indicators, the stock price of SMMV is likely to experience a short-term upward movement in the coming days. The convergence of MACD, oversold conditions in momentum indicators, and decreasing volatility point towards a potential bullish scenario. However, investors should remain cautious due to the divergence in volume indicators and negative CMF. It is advisable to closely monitor the price action and key support/resistance levels for confirmation of the anticipated upward trend.