Technical Analysis of SPDV 2024-05-31
Overview:
In analyzing the technical indicators for SPDV over the last 5 days, we will delve into the trend, momentum, volatility, and volume indicators to provide a comprehensive outlook on the possible stock price movement. By examining these key aspects, we aim to offer valuable insights and predictions for the upcoming days.
Trend Analysis:
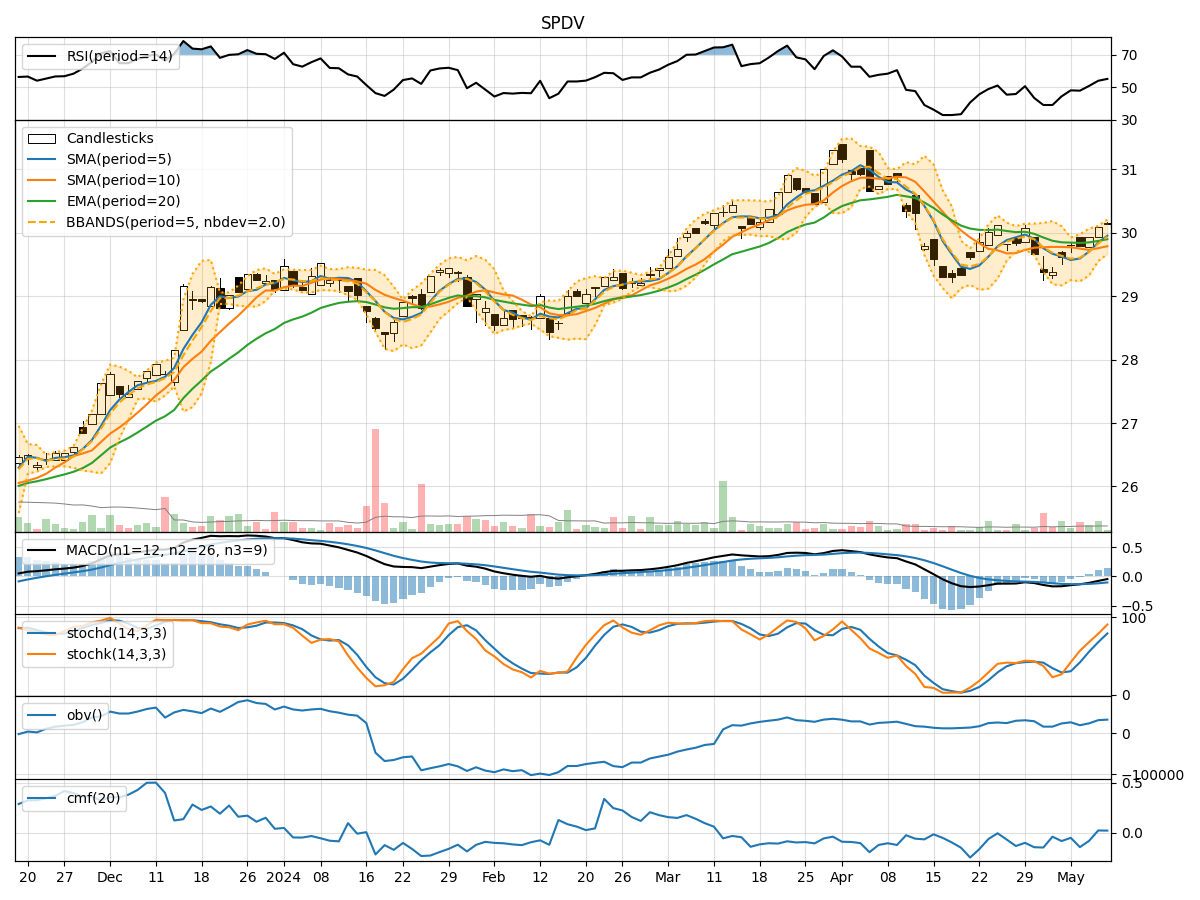
- Moving Averages (MA): The 5-day MA has been consistently below the closing prices, indicating a short-term downtrend.
- MACD: The MACD line has been below the signal line, suggesting a bearish momentum.
- EMA: The EMA has been trending downwards, reflecting a weakening trend.
Key Observation: The trend indicators point towards a bearish sentiment in the short term.
Momentum Analysis:
- RSI: The RSI has been declining, indicating a decrease in buying momentum.
- Stochastic Oscillator: Both %K and %D have been trending downwards, signaling a potential oversold condition.
- Williams %R: The indicator has been consistently in the oversold territory, suggesting a bearish sentiment.
Key Observation: Momentum indicators align with the trend, indicating a bearish momentum in the stock.
Volatility Analysis:
- Bollinger Bands (BB): The stock price has been trading below the lower Bollinger Band, indicating oversold conditions.
- Bollinger Band Width: The band width has widened, suggesting increased volatility.
- Bollinger Band %B: The %B indicator is below 0.2, indicating an oversold condition.
Key Observation: Volatility indicators signal an oversold market with increased volatility.
Volume Analysis:
- On-Balance Volume (OBV): The OBV has been relatively stable, indicating a balance between buying and selling pressure.
- Chaikin Money Flow (CMF): The CMF has been positive, suggesting a net inflow of money into the stock.
Key Observation: Volume indicators show a neutral stance with a slight positive bias.
Conclusion:
Based on the analysis of trend, momentum, volatility, and volume indicators, the overall outlook for SPDV in the next few days is bearish. The stock is likely to experience further downward pressure based on the consistent bearish signals across multiple indicators. Traders and investors should exercise caution and consider short-term selling opportunities or wait for a potential reversal confirmation before considering long positions.
Key Takeaways:
- Direction: Downward
- Momentum: Bearish
- Volatility: Oversold with increased volatility
- Volume: Neutral with slight positive bias
In conclusion, a prudent approach would be to monitor the stock closely for any signs of reversal or stabilization before considering entry points. It is essential to combine technical analysis with fundamental research for a holistic view of the stock's potential movements.