Technical Analysis of SPDW 2024-05-31
Overview:
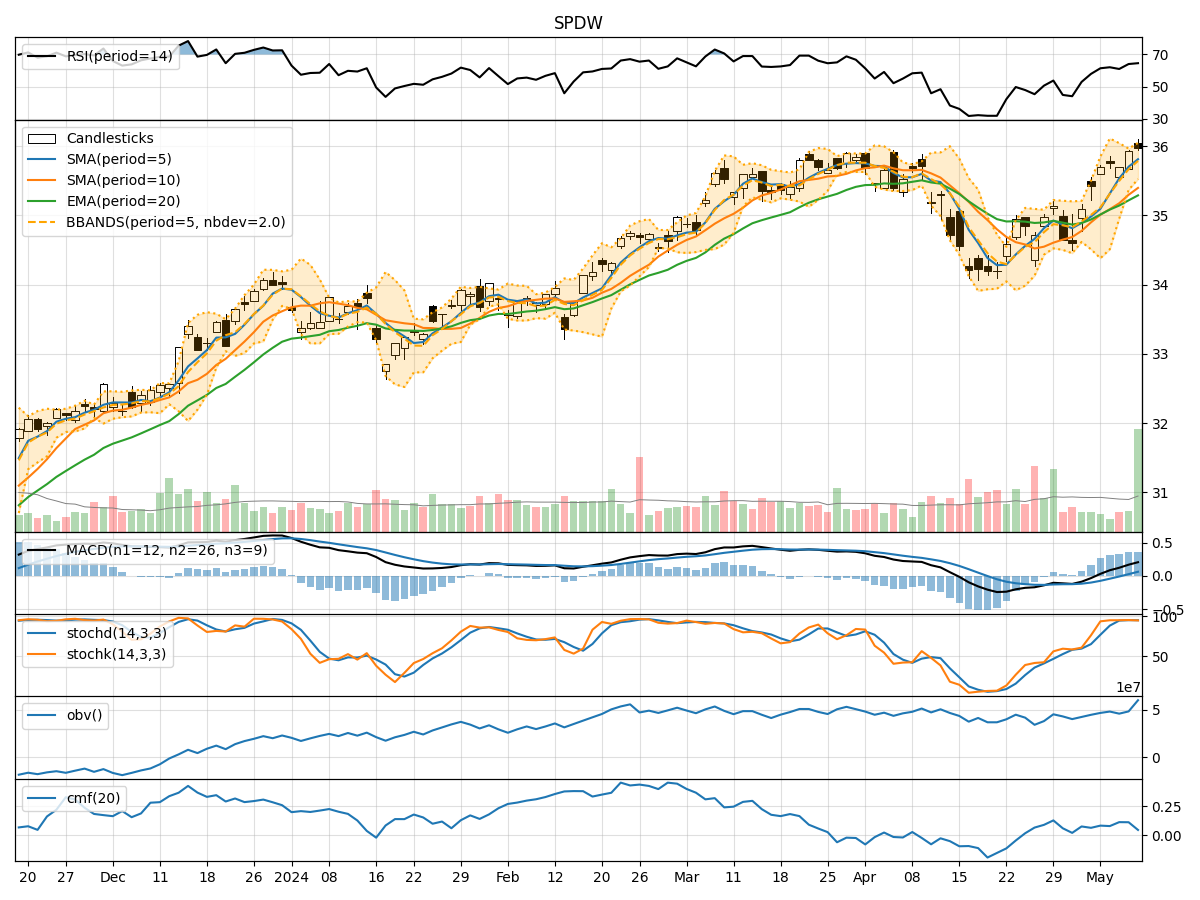
In analyzing the technical indicators for SPDW over the last 5 days, we will delve into the trend, momentum, volatility, and volume indicators to provide a comprehensive outlook on the possible stock price movement in the coming days. By examining these key indicators, we aim to offer valuable insights and predictions for informed decision-making.
Trend Indicators:
- Moving Averages (MA): The 5-day MA has been fluctuating around the closing prices, indicating short-term price trends. The SMA(10) and EMA(20) have shown slight declines, suggesting a potential weakening trend.
- Moving Average Convergence Divergence (MACD): The MACD line has been hovering around the signal line, with the MACD histogram showing a slight decrease, signaling a possible shift towards bearish momentum.
Momentum Indicators:
- Relative Strength Index (RSI): The RSI has been fluctuating within the neutral zone, indicating indecision in the market sentiment.
- Stochastic Oscillator: Both %K and %D have been declining, suggesting a potential bearish momentum.
- Williams %R (Willams %R): The Williams %R has been in oversold territory, indicating a possible reversal in the short term.
Volatility Indicators:
- Bollinger Bands (BB): The stock price has been trading within the Bollinger Bands, with the bands narrowing, indicating reduced volatility.
- Bollinger %B (BB %B): The %B has been fluctuating around the midline, suggesting a balanced market sentiment.
Volume Indicators:
- On-Balance Volume (OBV): The OBV has shown a slight increase, indicating accumulation by investors.
- Chaikin Money Flow (CMF): The CMF has been positive, suggesting buying pressure in the market.
Key Observations:
- The trend indicators point towards a potential weakening trend, with the possibility of a bearish momentum shift.
- Momentum indicators reflect indecision in market sentiment, with a slight bearish bias.
- Volatility indicators indicate reduced volatility and a balanced market sentiment.
- Volume indicators suggest accumulation by investors and buying pressure in the market.
Conclusion:
Based on the analysis of the technical indicators, the outlook for SPDW in the next few days leans towards a potential downward movement. The trend indicators and momentum indicators suggest a weakening trend and bearish momentum, respectively. While volatility remains low, indicating stability, the volume indicators point towards accumulation and buying pressure. Therefore, considering the overall analysis, it is advisable to exercise caution and consider a bearish view for the upcoming days in SPDW.