Technical Analysis of SPTL 2024-05-31
Overview:
In analyzing the technical indicators for SPTL over the last 5 days, we will delve into the trend, momentum, volatility, and volume indicators to provide a comprehensive outlook on the possible stock price movement in the coming days. By examining these key aspects, we aim to offer valuable insights and predictions for potential investors.
Trend Analysis:
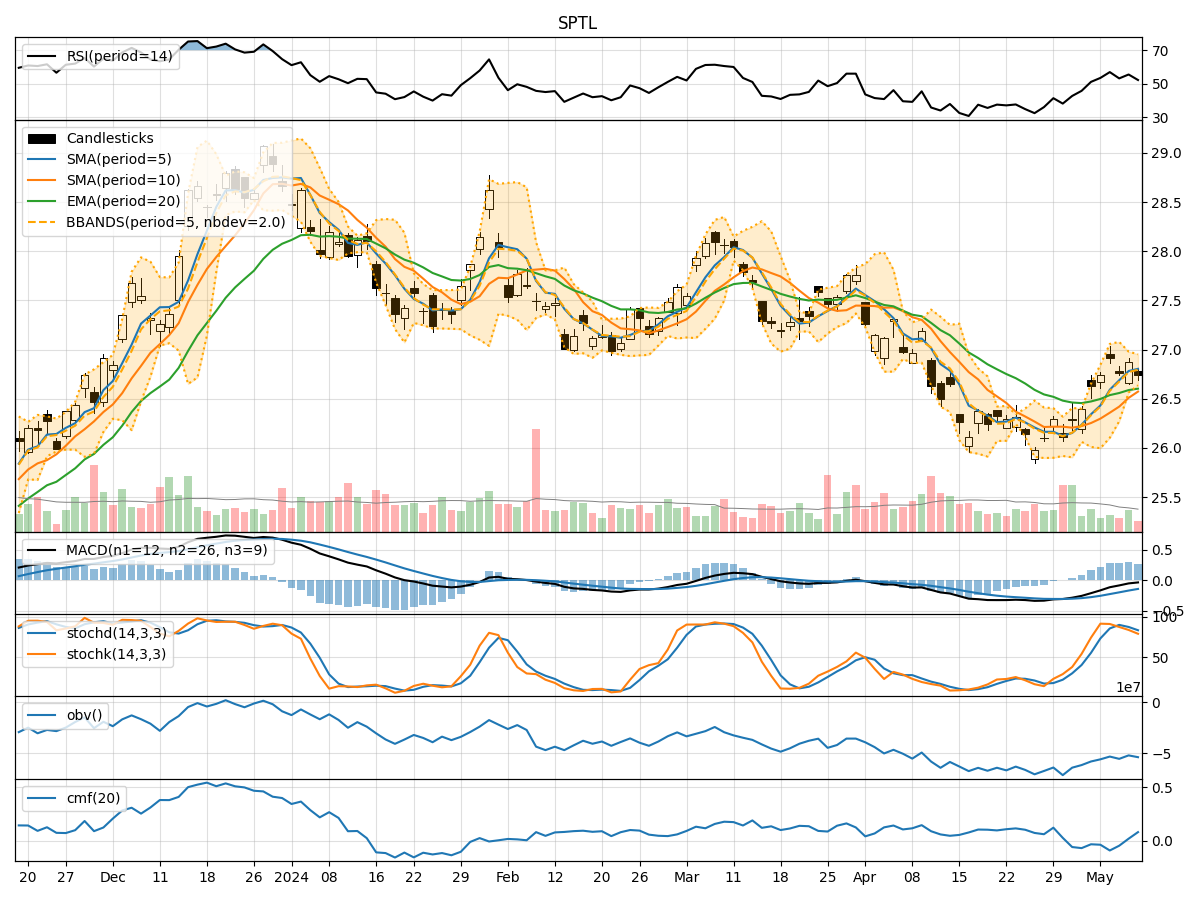
- Moving Averages (MA): The 5-day Moving Average (MA) has been gradually decreasing from 27.082 to 26.748, indicating a downward trend in the stock price.
- MACD: The MACD line has been consistently positive, suggesting a bullish momentum in the short term.
- EMA: The Exponential Moving Average (EMA) has also been declining, aligning with the decreasing stock price trend.
Key Observation: The moving averages and EMA indicate a bearish trend, while the MACD suggests a short-term bullish momentum.
Momentum Analysis:
- RSI: The Relative Strength Index (RSI) has been fluctuating but remains below 50, indicating a bearish sentiment in the market.
- Stochastic Oscillator: Both %K and %D have been decreasing, signaling a potential oversold condition.
- Williams %R: The Williams %R is consistently in the oversold territory, indicating a bearish momentum.
Key Observation: Momentum indicators suggest a bearish sentiment with potential oversold conditions.
Volatility Analysis:
- Bollinger Bands (BB): The Bollinger Bands have been narrowing, indicating decreasing volatility in the stock price.
- BB% (Bollinger Bands %B): The %B has been decreasing, suggesting a consolidation phase in the stock price.
Key Observation: Volatility indicators point towards decreasing volatility and a possible consolidation phase.
Volume Analysis:
- On-Balance Volume (OBV): The OBV has been fluctuating but remains negative, indicating selling pressure in the market.
- Chaikin Money Flow (CMF): The CMF has been positive, suggesting some buying interest in the stock.
Key Observation: Volume indicators reflect selling pressure but also show some buying interest in the stock.
Conclusion:
Based on the analysis of the technical indicators, the stock price of SPTL is likely to experience further downward movement in the coming days. The trend indicators suggest a bearish sentiment, supported by momentum indicators indicating oversold conditions. Volatility indicators point towards a consolidation phase, while volume indicators reflect selling pressure with some buying interest.
Recommendation:
Considering the overall bearish outlook, investors should exercise caution and consider waiting for a more favorable entry point before considering any long positions. Short-term traders may find opportunities to capitalize on the downward momentum, but risk management is crucial in volatile market conditions.
Key Conclusion: Downward movement is expected in the next few days for SPTL based on the technical analysis provided.