Technical Analysis of SPXN 2024-05-31
Overview:
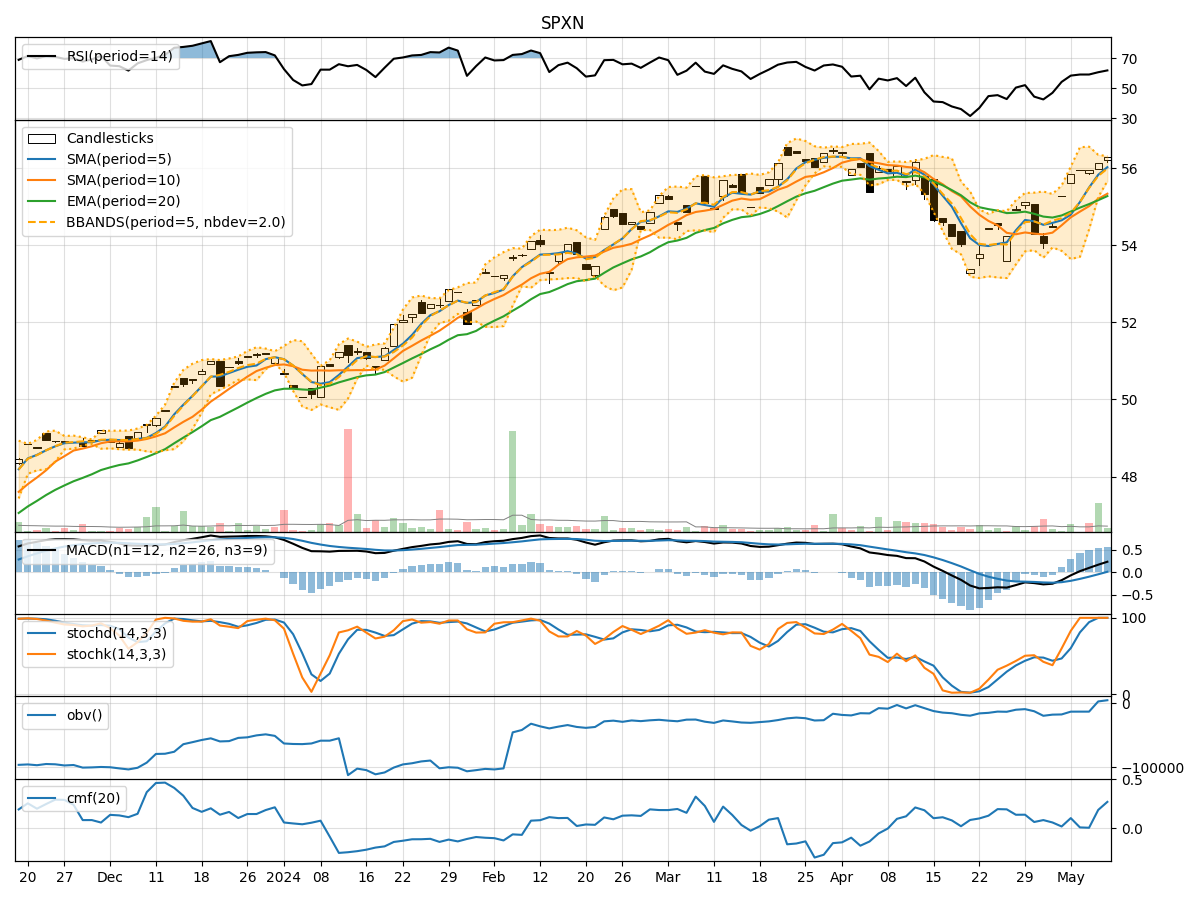
In analyzing the technical indicators for SPXN over the last 5 days, we will delve into the trend, momentum, volatility, and volume indicators to provide a comprehensive outlook on the possible stock price movement in the coming days. By examining these key indicators, we aim to offer valuable insights and predictions for informed decision-making.
Trend Analysis:
- Moving Averages (MA): The 5-day MA has been fluctuating around the closing prices, indicating short-term price trends. The SMA(10) and EMA(20) have shown a slight upward trend, suggesting potential bullish momentum.
- MACD: The MACD line has been positive, indicating a bullish trend, although the MACD histogram has shown a slight decrease in momentum.
- Conclusion: The trend indicators suggest a slightly bullish outlook for the stock.
Momentum Analysis:
- RSI: The RSI has been fluctuating but generally staying within the neutral range, indicating balanced buying and selling pressure.
- Stochastic Oscillator: Both %K and %D have been declining, suggesting a potential reversal in momentum to the downside.
- Conclusion: The momentum indicators point towards a neutral to slightly bearish sentiment.
Volatility Analysis:
- Bollinger Bands (BB): The bands have been narrowing, indicating decreasing volatility and a potential period of consolidation.
- Conclusion: Volatility indicators suggest a consolidation phase in the stock price.
Volume Analysis:
- On-Balance Volume (OBV): The OBV has been fluctuating, indicating mixed buying and selling pressure.
- Chaikin Money Flow (CMF): The CMF has been positive, suggesting a net inflow of money into the stock.
- Conclusion: Volume indicators reflect mixed sentiment in terms of buying and selling pressure.
Overall Conclusion:
Based on the analysis of trend, momentum, volatility, and volume indicators, the next few days for SPXN are likely to see sideways movement with a slightly bullish bias. The trend indicators point towards a potential continuation of the current upward trend, while momentum indicators suggest a neutral to slightly bearish sentiment. Volatility indicators indicate a consolidation phase, and volume indicators show mixed buying and selling pressure.
Key Recommendations:
- Monitor Price Levels: Keep a close eye on key support and resistance levels to gauge potential breakout or reversal points.
- Watch Momentum: Pay attention to any shifts in momentum indicators for early signals of a trend reversal.
- Consider Risk Management: Implement appropriate risk management strategies to protect against unexpected price movements.
- Stay Informed: Stay updated on market news and events that could impact the stock price.
In conclusion, while the overall outlook for SPXN suggests a sideways movement with a slightly bullish bias, it is essential to remain vigilant and adapt to changing market conditions for successful trading decisions.