Technical Analysis of SPYI 2024-05-31
Overview:
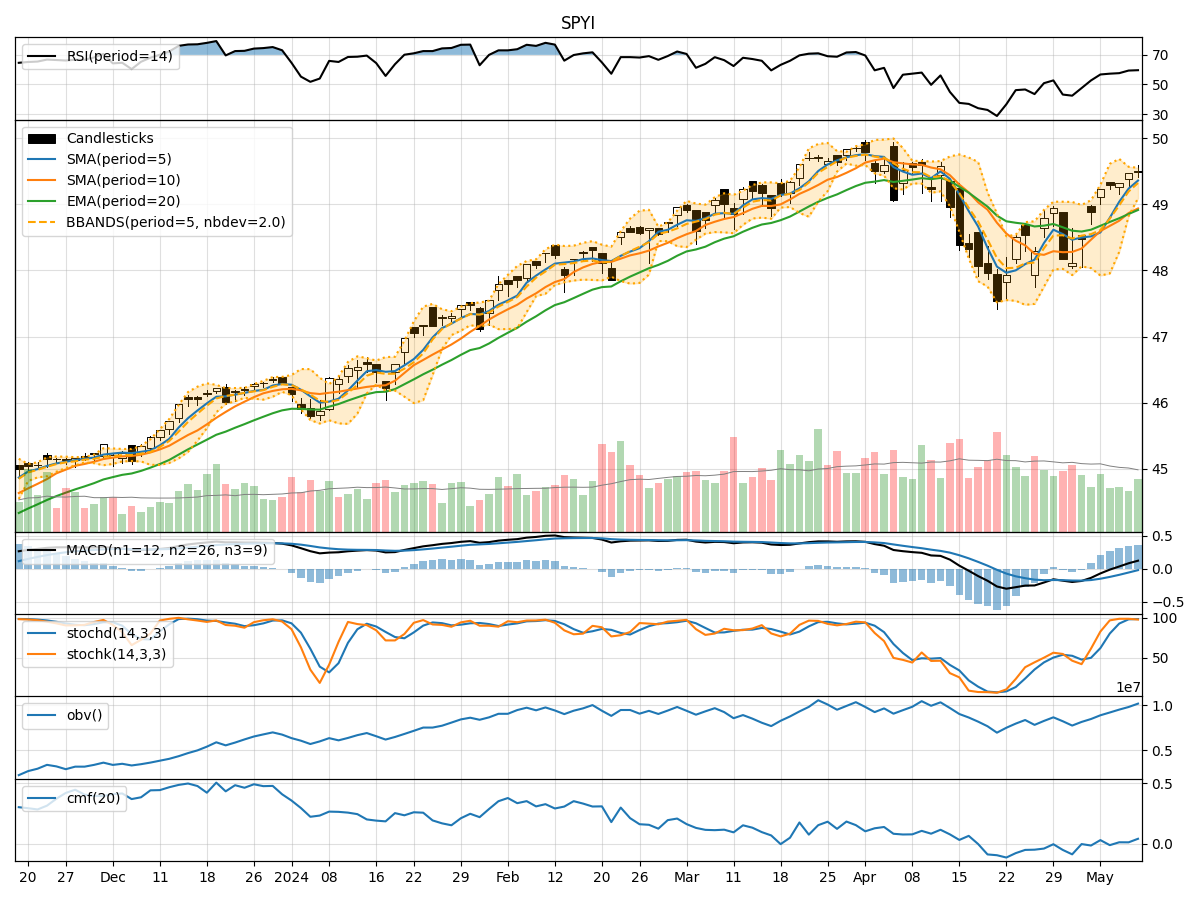
In the last 5 trading days, SPYI has shown mixed signals across various technical indicators. The trend indicators suggest a slightly bullish sentiment, with the moving averages and MACD showing positive trends. However, momentum indicators like RSI and Stochastic oscillators indicate a more neutral to bearish outlook. Volatility indicators show a narrowing of the Bollinger Bands, indicating potential consolidation. Volume indicators also suggest a neutral stance.
Trend Indicators:
- Moving Averages (MA): The 5-day MA is slightly above the 10-day SMA, indicating a short-term bullish trend.
- MACD: The MACD line is positive, but the MACD Histogram is decreasing, suggesting a weakening bullish momentum.
Momentum Indicators:
- RSI: The RSI is hovering around 60, indicating a neutral stance with no clear overbought or oversold conditions.
- Stochastic Oscillators: Both %K and %D are declining, signaling a potential bearish momentum shift.
Volatility Indicators:
- Bollinger Bands (BB): The bands are narrowing, indicating decreasing volatility and a possible period of consolidation.
Volume Indicators:
- On-Balance Volume (OBV): The OBV has been relatively stable, showing no significant accumulation or distribution.
- Chaikin Money Flow (CMF): The CMF is positive, suggesting some buying pressure but not at extreme levels.
Key Observations:
- The trend indicators suggest a mild bullish bias, but the weakening MACD Histogram raises concerns about the sustainability of the uptrend.
- Momentum indicators show a lack of strong buying pressure, with the Stochastic indicators hinting at a potential bearish reversal.
- Volatility indicators point towards a period of consolidation, with decreasing price fluctuations.
- Volume indicators do not provide a clear direction, indicating a lack of significant buying or selling pressure.
Conclusion:
Based on the analysis of the technical indicators, the next few days for SPYI are likely to see sideways movement or consolidation. The mixed signals from trend, momentum, volatility, and volume indicators suggest a lack of clear direction in the near term. Traders may consider staying cautious and monitoring for a clearer trend to emerge before making significant trading decisions.