Technical Analysis of SQQQ 2024-05-10
Overview:
In analyzing the technical indicators for SQQQ over the last 5 days, we will delve into the trend, momentum, volatility, and volume indicators to provide a comprehensive outlook on the possible stock price movement in the coming days. By examining these key aspects, we aim to offer valuable insights and predictions for informed decision-making.
Trend Analysis:
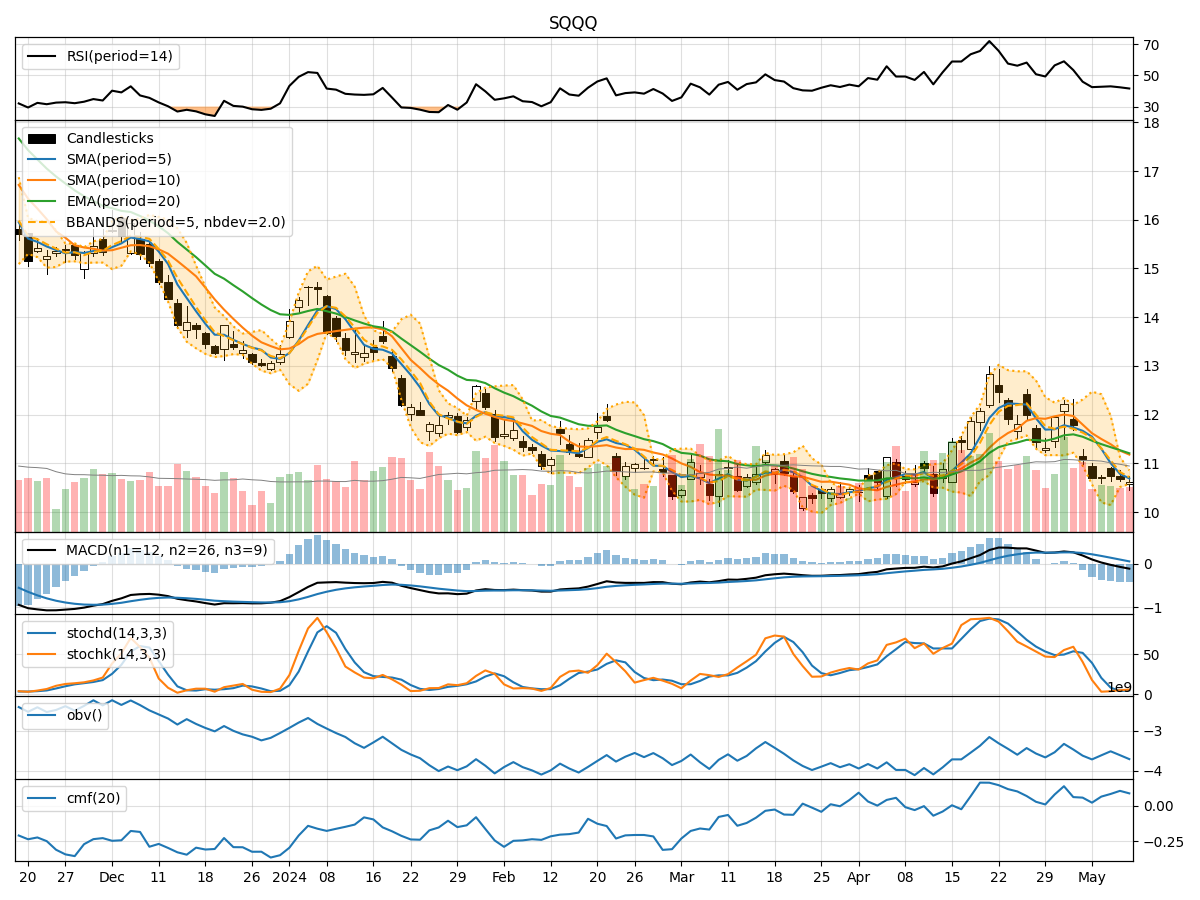
- Moving Averages (MA): The 5-day Moving Average (MA) has been consistently below the Simple Moving Average (SMA) and Exponential Moving Average (EMA), indicating a downward trend.
- MACD: The MACD line has been below the signal line, with decreasing values over the past 5 days, suggesting a bearish momentum.
Momentum Analysis:
- RSI: The Relative Strength Index (RSI) has been declining and is currently below 50, indicating a weakening momentum.
- Stochastic Oscillator: Both %K and %D have been low, signaling oversold conditions.
Volatility Analysis:
- Bollinger Bands (BB): The stock price has been consistently below the middle Bollinger Band (BBM), indicating a lower volatility period.
Volume Analysis:
- On-Balance Volume (OBV): The OBV has been decreasing, suggesting a divergence between price and volume.
- Chaikin Money Flow (CMF): The CMF has been positive but showing a slight decrease, indicating some selling pressure.
Key Observations and Opinions:
- Trend: The trend is downward as indicated by the moving averages and MACD.
- Momentum: Momentum is weak with RSI below 50 and stochastic indicators in oversold territory.
- Volatility: Volatility is low based on the Bollinger Bands analysis.
- Volume: Volume is decreasing, signaling a potential lack of conviction in the current price trend.
Conclusion:
Based on the analysis of the technical indicators, the next few days for SQQQ are likely to see a continuation of the downward trend with weak momentum and low volatility. Traders and investors should exercise caution and consider potential short-term bearish positions or wait for a clearer signal before entering new positions. It is advisable to closely monitor key support levels and wait for signs of a reversal before considering any long positions.