Technical Analysis of SSG 2024-05-31
Overview:
In analyzing the technical indicators for SSG stock over the last 5 days, we will delve into the trend, momentum, volatility, and volume indicators to provide a comprehensive outlook on the possible stock price movement in the coming days. By examining these key indicators, we aim to offer valuable insights and predictions for potential investors.
Trend Analysis:
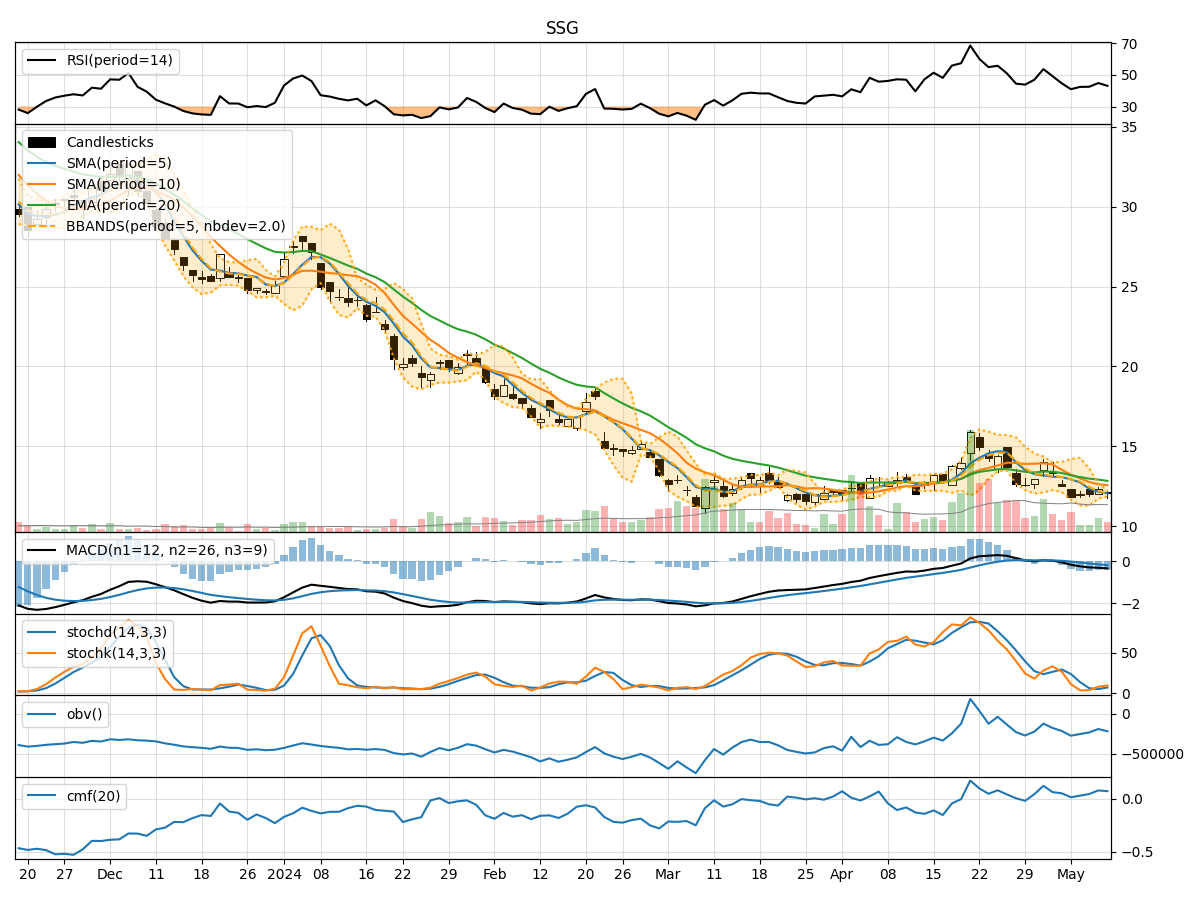
- Moving Averages (MA): The 5-day MA has been consistently below the closing prices, indicating a downward trend.
- MACD: The MACD line has been negative, with the MACD histogram showing a decreasing trend, signaling bearish momentum.
Momentum Analysis:
- RSI: The RSI has been relatively low, indicating oversold conditions in the stock.
- Stochastic Oscillator: Both %K and %D have been trending downwards, suggesting weakening momentum.
Volatility Analysis:
- Bollinger Bands (BB): The stock price has been consistently below the lower Bollinger Band, indicating oversold conditions.
Volume Analysis:
- On-Balance Volume (OBV): The OBV has shown mixed signals, with some days experiencing selling pressure and others showing accumulation.
- Chaikin Money Flow (CMF): The CMF has been negative, indicating outflows from the stock.
Key Observations:
- The stock is currently in a downtrend based on moving averages and MACD analysis.
- Momentum indicators suggest oversold conditions and weakening momentum.
- Volatility indicators point towards oversold conditions as the stock price is consistently below the lower Bollinger Band.
- Volume indicators show mixed signals with selling pressure and accumulation.
Conclusion:
Based on the analysis of the technical indicators, the next few days' possible stock price movement for SSG is likely to be sideways to slightly bearish. The stock is currently in a downtrend with oversold conditions, indicating a potential consolidation phase or a slight downward movement. Investors should exercise caution and closely monitor the stock's price action for any signs of a reversal or trend confirmation before making any investment decisions.