Technical Analysis of SUSL 2024-05-31
Overview:
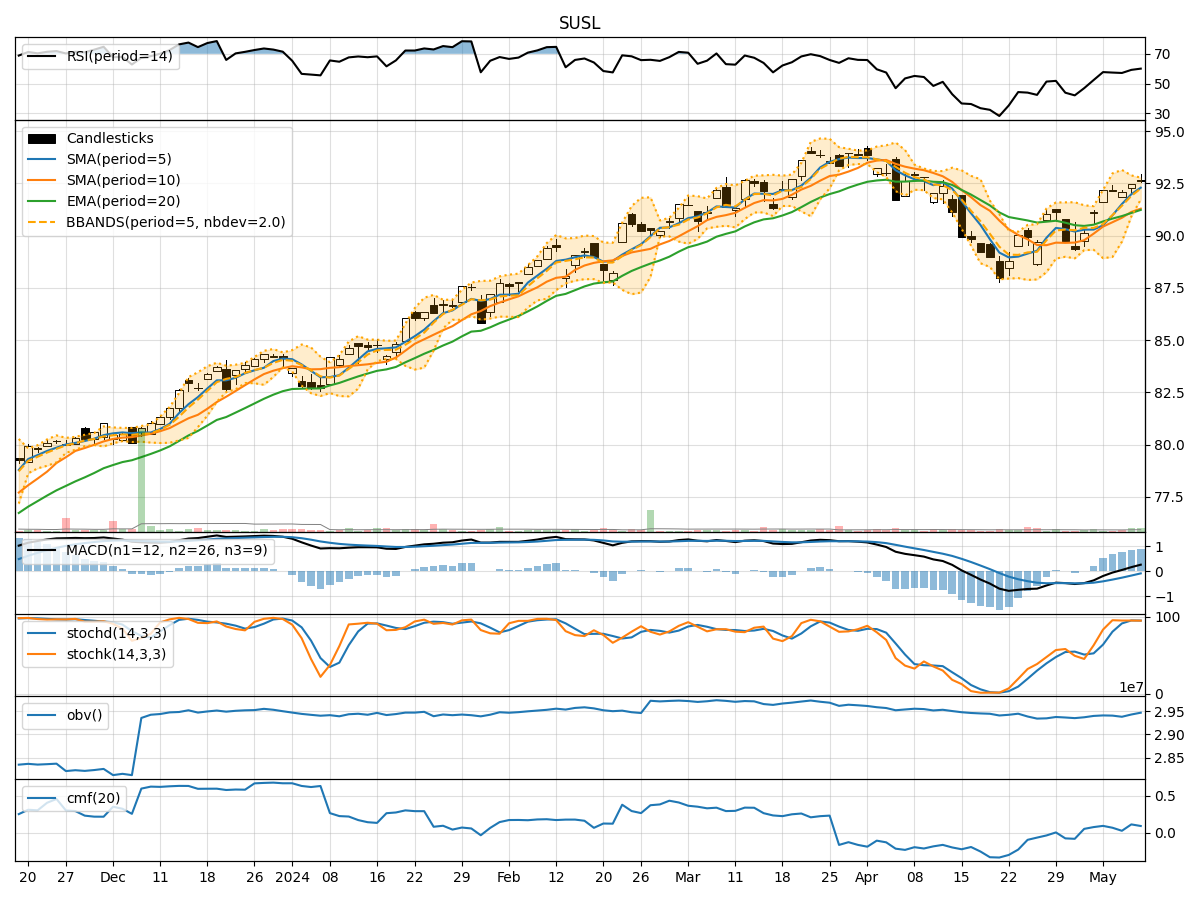
In analyzing the technical indicators for SUSL over the last 5 days, we will delve into the trend, momentum, volatility, and volume indicators to provide a comprehensive outlook on the possible stock price movement. By examining these key aspects, we aim to offer valuable insights and predictions for the upcoming days.
Trend Analysis:
- Moving Averages (MA): The 5-day Moving Average (MA) has been fluctuating around the closing prices, indicating short-term price trends. The Simple Moving Average (SMA) and Exponential Moving Average (EMA) show a gradual increase over the period.
- MACD: The Moving Average Convergence Divergence (MACD) and its signal line (MACDH) have been positive, suggesting bullish momentum in the stock price.
Momentum Analysis:
- RSI: The Relative Strength Index (RSI) has shown fluctuations but generally remains in the neutral zone, indicating a balanced momentum.
- Stochastic Oscillator: Both %K and %D have been declining, signaling a potential bearish momentum.
Volatility Analysis:
- Bollinger Bands (BB): The Bollinger Bands have widened, indicating increased volatility in the stock price. The bands have been expanding, suggesting potential price swings.
Volume Analysis:
- On-Balance Volume (OBV): The OBV has shown a mixed trend, indicating indecision among investors regarding the stock.
- Chaikin Money Flow (CMF): The CMF has been positive, reflecting buying pressure in the market.
Key Observations:
- The trend indicators suggest a bullish sentiment with increasing moving averages and positive MACD.
- Momentum indicators show a mixed picture with RSI in the neutral zone but stochastic oscillators indicating a bearish momentum.
- Volatility has increased, as seen in the widening Bollinger Bands, indicating potential price swings.
- Volume indicators reflect indecision among investors, with OBV showing a mixed trend and CMF indicating buying pressure.
Conclusion:
Based on the analysis of the technical indicators, the stock price of SUSL is likely to experience increased volatility in the upcoming days. The bullish trend indicated by moving averages and MACD may face resistance due to the bearish momentum suggested by stochastic oscillators. Investors should closely monitor price movements and key support/resistance levels to make informed trading decisions. Exercise caution in trading SUSL as the stock may enter a period of consolidation or sideways movement.