Technical Analysis of SYNB 2024-05-31
Overview:
In analyzing the technical indicators for SYNB over the last 5 days, we will delve into the trend, momentum, volatility, and volume indicators to provide a comprehensive outlook on the possible stock price movement in the coming days. By examining these key indicators, we aim to offer valuable insights and predictions for potential investors.
Trend Indicators:
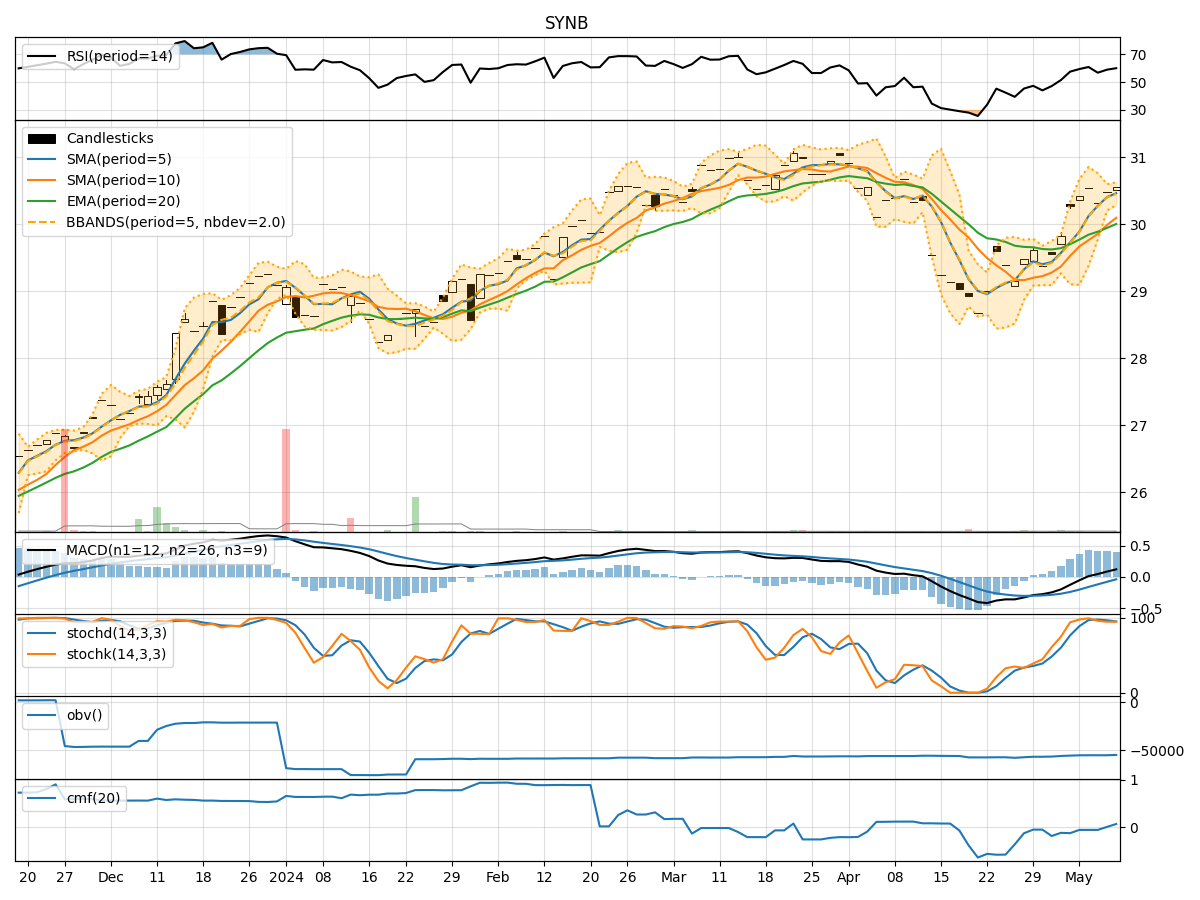
- Moving Averages (MA): The 5-day MA has been fluctuating around the closing prices, indicating a short-term trend. Both the SMA(10) and EMA(20) have shown slight upward movements, suggesting a potential bullish sentiment.
- MACD and Signal Line: The MACD line has been positive, indicating a bullish trend. The MACD Histogram has been decreasing but remains above the signal line, suggesting a potential reversal or consolidation.
Momentum Indicators:
- RSI: The RSI has been fluctuating around the 50 level, indicating a neutral momentum in the stock.
- Stochastic Oscillator: Both %K and %D have been declining, entering oversold territory, signaling a potential reversal or consolidation.
- Williams %R: The indicator has been in oversold territory, suggesting a potential buying opportunity.
Volatility Indicators:
- Bollinger Bands (BB): The stock price has been trading within the bands, indicating a period of consolidation. The bands have started to narrow, suggesting a potential breakout in the near future.
- Bollinger %B: The %B indicator has been fluctuating around the midline, indicating a balanced market sentiment.
Volume Indicators:
- On-Balance Volume (OBV): The OBV has been relatively stable, suggesting a neutral volume flow in the stock.
- Chaikin Money Flow (CMF): The CMF has been gradually increasing, indicating a potential influx of buying pressure.
Key Observations and Opinions:
- Trend: The trend indicators suggest a potential bullish sentiment in the short term, supported by the moving averages and MACD line.
- Momentum: The momentum indicators show a neutral to slightly bearish momentum, with the RSI hovering around 50 and stochastic indicators in oversold territory.
- Volatility: The volatility indicators point towards a period of consolidation, with the Bollinger Bands narrowing and %B hovering around the midline.
- Volume: The volume indicators indicate a neutral volume flow, with the OBV remaining stable and CMF showing a slight increase in buying pressure.
Conclusion:
Based on the analysis of the technical indicators, the next few days for SYNB could see sideways movement with a slight bullish bias. Traders may expect the stock price to consolidate within a range, potentially leading to a breakout in the near future. It is advisable to closely monitor the key support and resistance levels, as well as any significant news or market developments that could impact the stock price movement.