Technical Analysis of TBG 2024-05-31
Overview:
In analyzing the technical indicators for TBG stock over the last 5 days, we will delve into the trend, momentum, volatility, and volume indicators to provide a comprehensive outlook on the possible future stock price movement. By examining these key indicators, we aim to offer valuable insights and predictions for the upcoming trading days.
Trend Analysis:
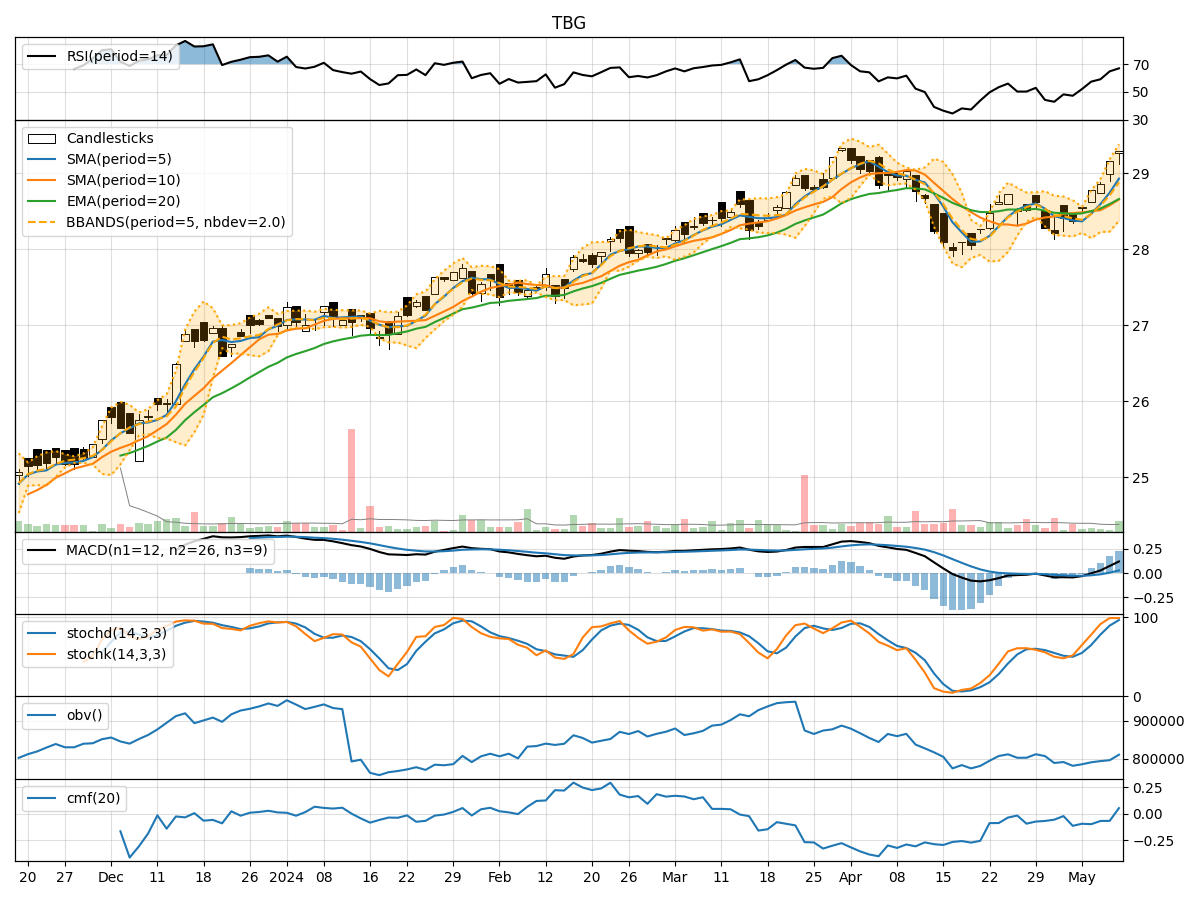
- Moving Averages (MA): The 5-day Moving Average (MA) has been consistently below the Simple Moving Average (SMA) and Exponential Moving Average (EMA), indicating a downward trend.
- MACD: The MACD line has been below the signal line, with negative values for MACD Histogram, suggesting a bearish momentum in the short term.
Momentum Analysis:
- RSI: The Relative Strength Index (RSI) has been fluctuating around the 50 level, indicating a lack of strong momentum in either direction.
- Stochastic Oscillator: Both %K and %D have been relatively low, signaling potential oversold conditions in the market.
Volatility Analysis:
- Bollinger Bands (BB): The stock price has been trading within the Bollinger Bands, with the bands narrowing, suggesting decreasing volatility.
- Bollinger %B: The %B indicator has been hovering around the middle range, indicating a neutral stance in terms of volatility.
Volume Analysis:
- On-Balance Volume (OBV): The OBV has shown a slight decrease over the last few days, indicating some selling pressure in the stock.
- Chaikin Money Flow (CMF): The CMF has been positive but decreasing, suggesting a potential weakening of buying pressure.
Conclusion:
Based on the analysis of the technical indicators, the stock of TBG is likely to experience further downward movement in the coming days. The trend indicators, with MA below SMA and EMA, along with the bearish MACD signals, point towards a continued bearish sentiment. The momentum indicators, with RSI around 50 and stochastic indicators in oversold territory, do not show strong buying interest. Additionally, the volatility indicators suggest decreasing volatility, which may lead to a lack of significant price movements. The volume indicators also indicate a slight decrease in buying pressure.
Therefore, considering all the technical indicators and their respective analyses, the outlook for TBG stock is bearish in the near term. Traders and investors should exercise caution and consider potential short-selling opportunities or wait for a more favorable entry point before considering long positions.