Technical Analysis of TDVI 2024-05-31
Overview:
In analyzing the provided TDVI TA data for the last 5 days, we will delve into the technical indicators across trend, momentum, volatility, and volume to derive insights into the possible future stock price movement. By examining these indicators comprehensively, we aim to provide a well-informed prediction backed by data-driven analysis and expert interpretation.
Trend Analysis:
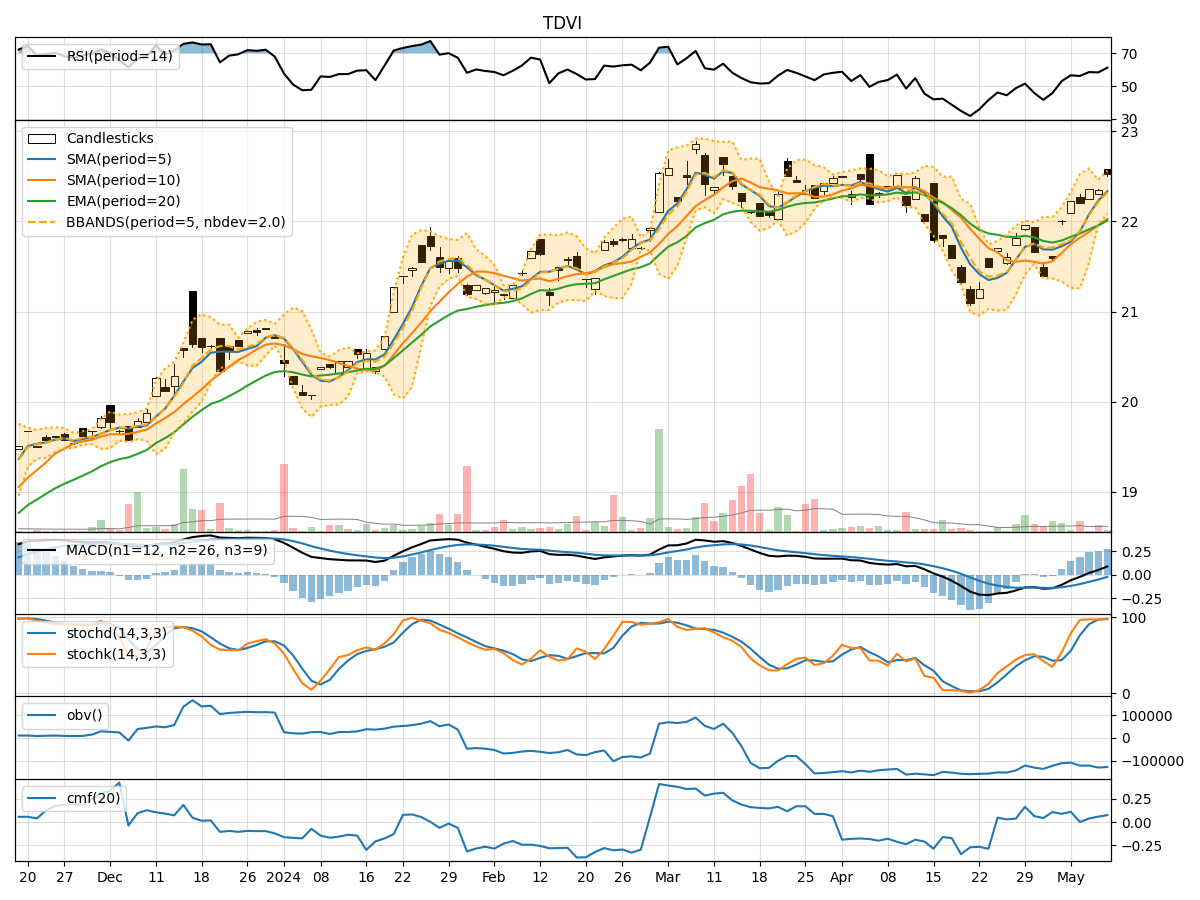
- Moving Averages (MA): The 5-day MA has been fluctuating around the closing prices, indicating short-term price trends. The SMA(10) and EMA(20) have shown a slight upward trend, suggesting potential bullish momentum.
- MACD and Signal Line: The MACD has been positive for the past 5 days, with the MACD line consistently above the signal line. This signals a bullish trend in the stock price.
- RSI and Stochastic Oscillator: The RSI has been above 50, indicating bullish momentum. The Stochastic Oscillator has shown a decline but remains in the overbought zone, suggesting a potential reversal.
Momentum Analysis:
- RSI: The RSI has been above 50, indicating bullish momentum in the stock price.
- Stochastic Oscillator: The Stochastic Oscillator has been in the overbought zone, suggesting a potential reversal or consolidation.
- Williams %R: The Williams %R has been in the oversold territory, indicating a potential buying opportunity.
Volatility Analysis:
- Bollinger Bands: The stock price has been trading within the Bollinger Bands, with the bands narrowing, indicating reduced volatility. This could signal a period of consolidation or a potential breakout.
- Bollinger %B: The %B indicator has been fluctuating around 0.5, suggesting the stock is trading around the middle band.
Volume Analysis:
- On-Balance Volume (OBV): The OBV has been negative, indicating selling pressure in the stock.
- Chaikin Money Flow (CMF): The CMF has been negative, suggesting outflow of money from the stock.
Conclusion:
Based on the analysis of the technical indicators, the stock shows mixed signals for the next few days. While the trend indicators point towards a bullish bias with positive MACD and RSI, the momentum indicators like Stochastic Oscillator and Williams %R suggest a potential reversal or consolidation. The volatility indicators signal reduced volatility and a possible period of sideways movement or consolidation. The volume indicators indicate selling pressure with negative OBV and CMF.
Recommendation:
Considering the overall analysis, it is advisable to exercise caution in trading this stock in the next few days. Traders may consider waiting for clearer signals or confirmation of a trend before making significant trading decisions. Monitoring key levels such as support and resistance, along with any potential breakout from the Bollinger Bands, can provide valuable insights for strategic entry or exit points.
Key Takeaways:
- Bullish Bias: Trend indicators suggest a bullish outlook.
- Mixed Momentum: Momentum indicators show conflicting signals.
- Reduced Volatility: Volatility indicators point towards decreased volatility.
- Selling Pressure: Volume indicators indicate selling pressure.
In conclusion, while the stock may experience some upward movement based on trend indicators, the conflicting signals from momentum indicators and selling pressure from volume indicators suggest a potential period of consolidation or reversal. Traders should remain vigilant and adapt their strategies accordingly to navigate the market dynamics effectively.