Technical Analysis of TMFG 2024-05-31
Overview:
In analyzing the technical indicators for TMFG stock over the last 5 days, we will delve into the trend, momentum, volatility, and volume indicators to provide a comprehensive outlook on the possible stock price movement in the coming days. By examining these key indicators, we aim to offer valuable insights and predictions for potential investors.
Trend Analysis:
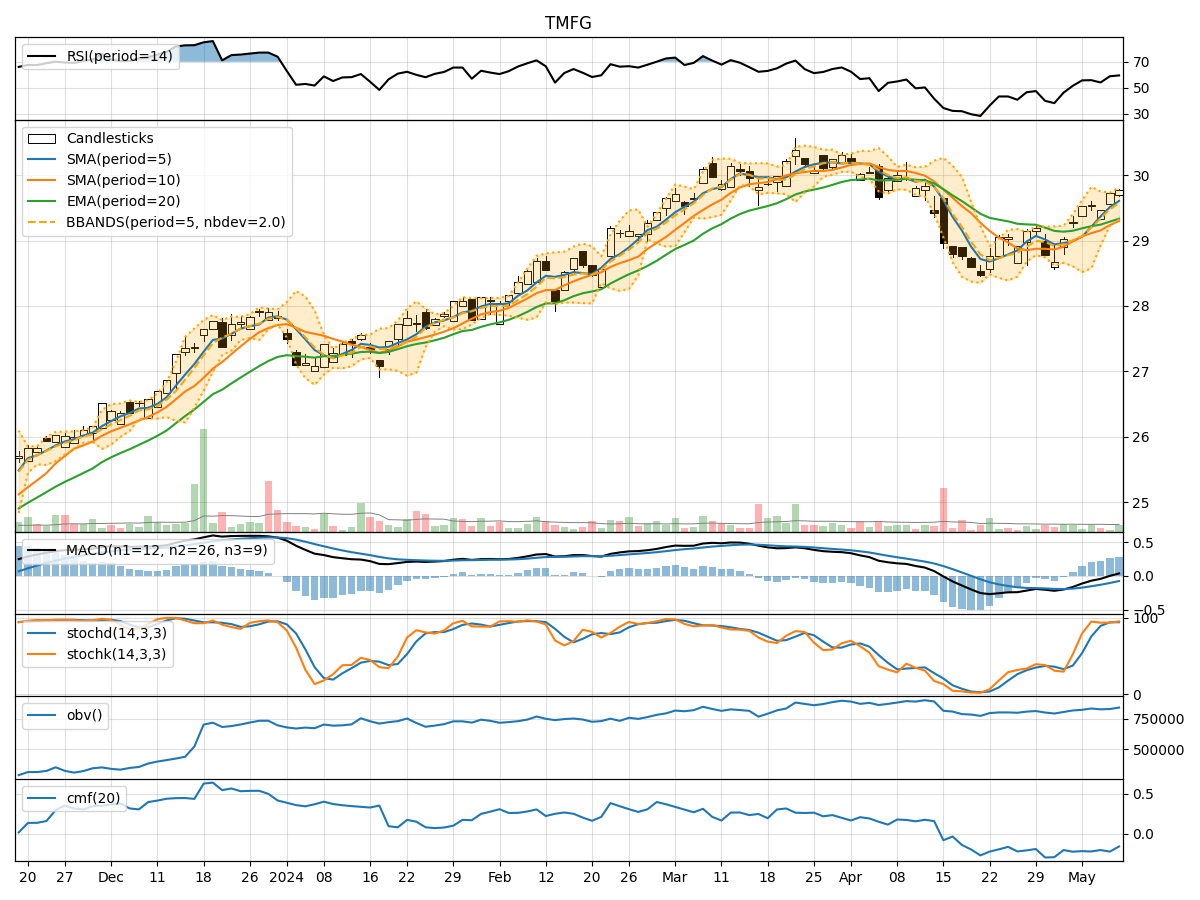
- Moving Averages (MA): The 5-day Moving Average (MA) has been gradually decreasing, indicating a short-term downtrend in the stock price.
- MACD: The Moving Average Convergence Divergence (MACD) has been negative, suggesting a bearish momentum in the stock.
- EMA: The Exponential Moving Average (EMA) has also been declining, reinforcing the bearish sentiment in the short to medium term.
Momentum Analysis:
- RSI: The Relative Strength Index (RSI) has been fluctuating around the mid-level, indicating a lack of strong momentum in either direction.
- Stochastic Oscillator: Both %K and %D have been relatively low, signaling a potential oversold condition in the stock.
- Williams %R: The Williams %R is in the oversold territory, suggesting a possible reversal or consolidation phase.
Volatility Analysis:
- Bollinger Bands (BB): The Bollinger Bands have been narrowing, indicating decreasing volatility in the stock price.
- BB% (BB Percentage): The BB% has been relatively low, suggesting a period of consolidation or a potential breakout in the near future.
Volume Analysis:
- On-Balance Volume (OBV): The OBV has shown mixed signals, reflecting indecision among market participants regarding the stock.
- Chaikin Money Flow (CMF): The CMF has been positive, indicating some buying pressure in the stock over the past 20 days.
Key Observations:
- The stock is currently in a short-term downtrend based on moving averages and MACD.
- Momentum indicators suggest a lack of strong directional momentum, with potential for a reversal from oversold levels.
- Volatility has been decreasing, indicating a period of consolidation or a potential breakout.
- Volume indicators show mixed signals, with some buying pressure evident in the OBV and CMF.
Conclusion:
Based on the analysis of the technical indicators, the stock is likely to experience a period of consolidation in the near term. The lack of strong momentum, narrowing volatility, and mixed volume signals suggest that the stock may trade within a range or undergo a potential breakout. Investors should closely monitor key support and resistance levels for potential entry or exit points. Caution is advised as the stock navigates this consolidation phase, and a clear trend direction may emerge once the indicators provide more definitive signals.