Technical Analysis of TPLC 2024-05-31
Overview:
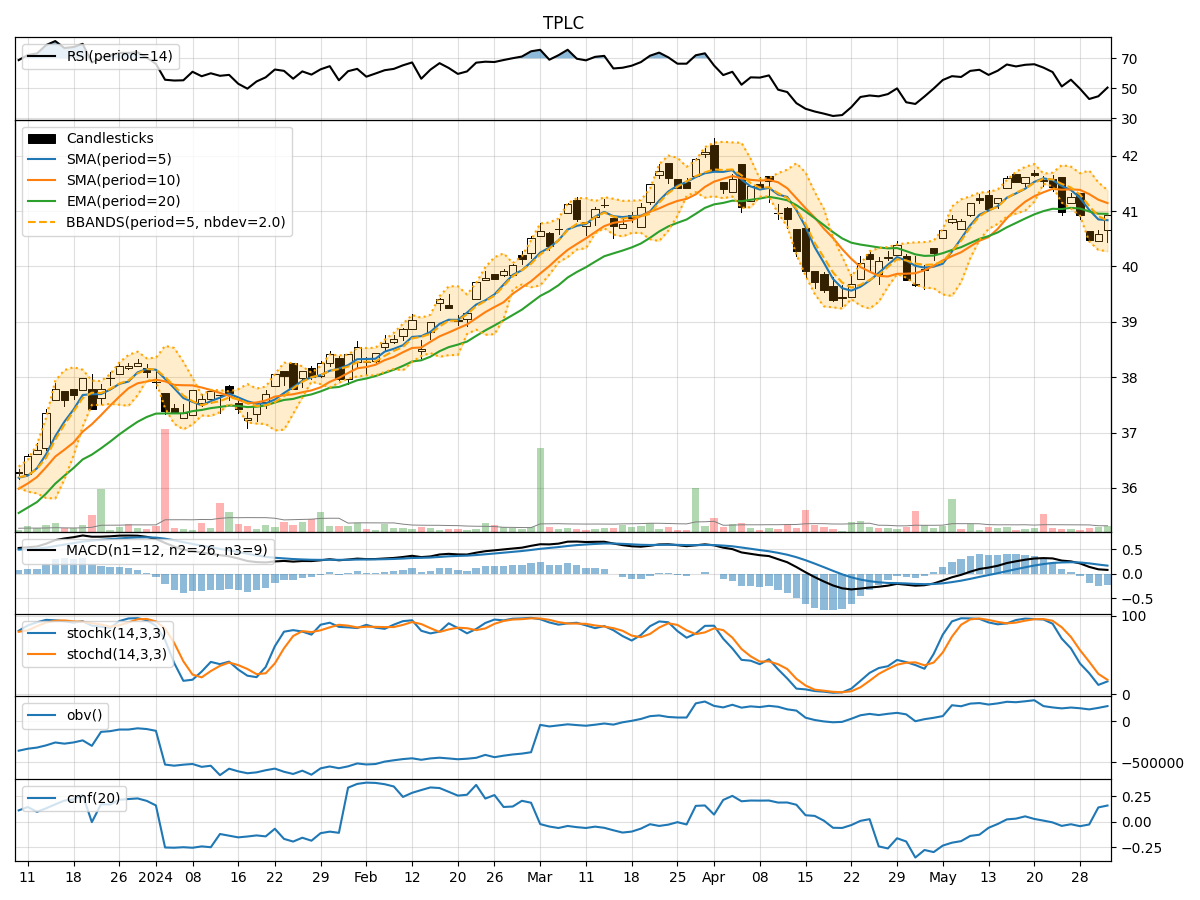
In analyzing the technical indicators for TPLC over the last 5 days, we will delve into the trends, momentum, volatility, and volume aspects to provide a comprehensive outlook on the possible stock price movement. By examining key indicators such as moving averages, MACD, RSI, Bollinger Bands, and OBV, we aim to offer valuable insights and predictions for the upcoming days.
Trend Analysis:
- Moving Averages (MA): The 5-day MA has been gradually decreasing, indicating a short-term bearish trend.
- MACD: The MACD line has been consistently positive, but the MACD histogram has been decreasing, suggesting a potential reversal in the bullish momentum.
- EMA: The EMA has been declining, further supporting the bearish sentiment in the short term.
Momentum Analysis:
- RSI: The RSI has been fluctuating around the neutral zone, indicating indecision in the market.
- Stochastic Oscillator: Both %K and %D have been decreasing, signaling a potential bearish momentum.
- Williams %R: The Williams %R is in oversold territory, suggesting a possible reversal to the upside.
Volatility Analysis:
- Bollinger Bands: The stock price has been trading within the lower Bollinger Band, indicating oversold conditions.
- Bollinger Band Width: The Band Width has been narrowing, suggesting a potential decrease in volatility.
- Bollinger Band %B: The %B indicator is below 0.2, indicating an oversold condition.
Volume Analysis:
- On-Balance Volume (OBV): The OBV has been fluctuating, reflecting mixed buying and selling pressure.
- Chaikin Money Flow (CMF): The CMF has been negative, indicating a lack of buying interest in the stock.
Key Observations:
- The stock is currently in a short-term bearish trend based on moving averages and EMA.
- Momentum indicators suggest a potential bearish bias in the near future.
- Volatility is low, indicating a possible consolidation phase.
- Volume indicators show mixed signals with no clear direction.
Conclusion:
Based on the technical analysis of TPLC, the stock is likely to experience further downward movement in the coming days. The bearish trend, coupled with weakening momentum and lackluster volume support, suggests a challenging period ahead for the stock. Traders and investors should exercise caution and consider waiting for more definitive signals before making any significant decisions.