Technical Analysis of TSLS 2024-05-31
Overview:
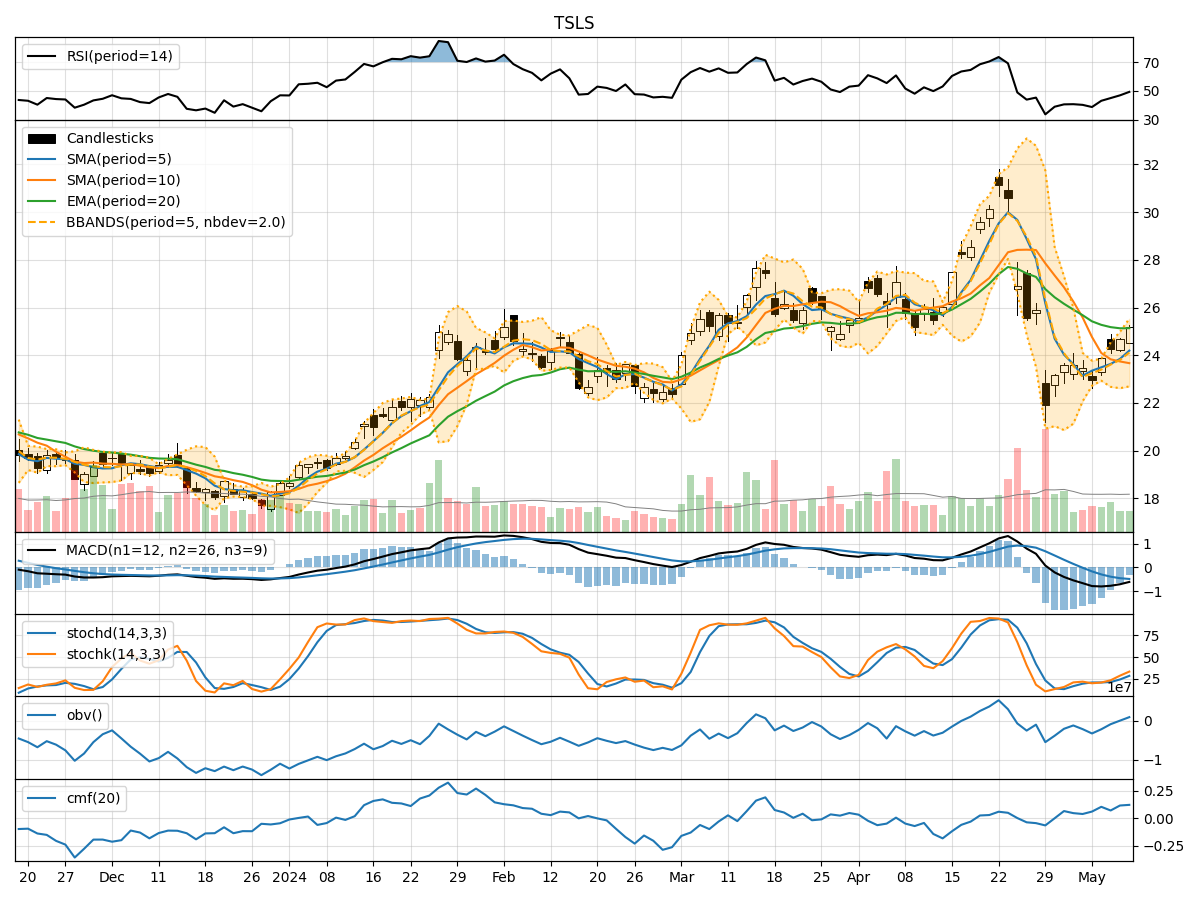
In the last 5 trading days, TSLS stock has shown mixed signals across various technical indicators. The stock price has fluctuated within a relatively narrow range, with some indicators suggesting potential bullish momentum while others indicating a possible consolidation phase. By analyzing trend, momentum, volatility, and volume indicators, we can gain a comprehensive understanding of the stock's potential future price movement.
Trend Indicators:
- Moving Averages (MA): The 5-day Moving Average (MA) has been fluctuating around the closing prices, indicating a lack of clear trend direction.
- MACD: The Moving Average Convergence Divergence (MACD) has shown slight positive values, suggesting a potential bullish momentum.
Momentum Indicators:
- RSI: The Relative Strength Index (RSI) has been hovering around the mid-range, indicating a neutral momentum.
- Stochastic Oscillator: Both %K and %D values have been fluctuating, showing indecision in momentum direction.
Volatility Indicators:
- Bollinger Bands (BB): The Bollinger Bands have been narrowing, indicating decreasing volatility and a possible upcoming breakout.
Volume Indicators:
- On-Balance Volume (OBV): The OBV has shown mixed movements, suggesting uncertainty in the buying and selling pressure.
- Chaikin Money Flow (CMF): The CMF has been relatively low, indicating a lack of strong buying or selling pressure.
Key Observations and Opinions:
- Trend: The stock is currently in a consolidation phase with no clear trend direction.
- Momentum: Momentum indicators suggest a neutral stance with no strong bullish or bearish bias.
- Volatility: Volatility is decreasing, indicating a potential period of consolidation before a breakout.
- Volume: Volume indicators show mixed signals, reflecting uncertainty in market participation.
Conclusion:
Based on the analysis of technical indicators, the next few days for TSLS stock are likely to see sideways movement with a potential for a breakout due to decreasing volatility. Investors should closely monitor the Bollinger Bands for a potential price breakout and consider the lack of strong momentum and volume signals when making trading decisions. Exercise caution and wait for a clear trend confirmation before taking significant positions.