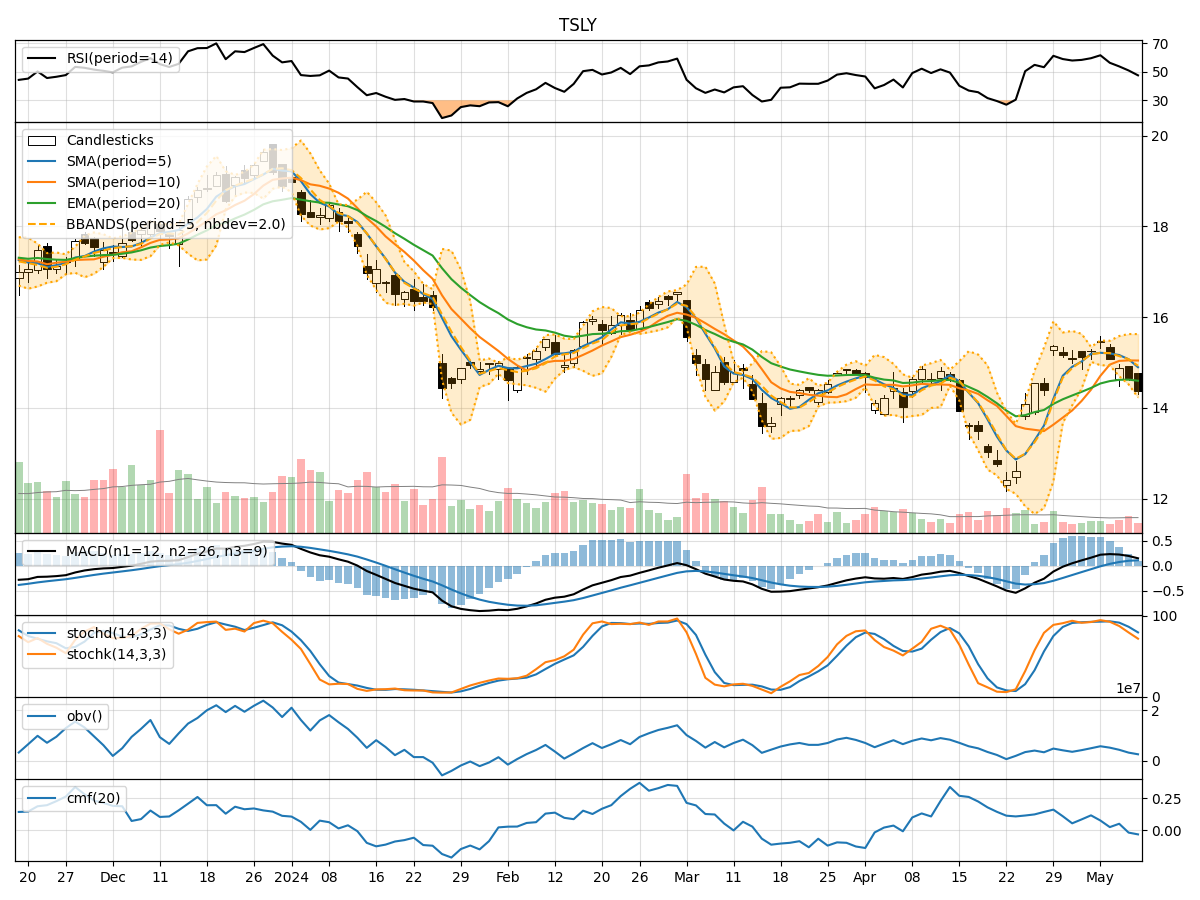
Technical Analysis of TSLY 2024-05-10
Overview:
In analyzing the technical indicators for TSLY over the last 5 days, we will delve into the trend, momentum, volatility, and volume indicators to provide a comprehensive outlook on the possible stock price movement in the coming days.
Trend Indicators:
- Moving Averages (MA): The 5-day MA has been gradually decreasing, indicating a short-term bearish trend.
- MACD: The MACD line has been consistently above the signal line, suggesting a bullish momentum.
- EMA: The EMA has been slightly increasing, showing a potential reversal in the downtrend.
Momentum Indicators:
- RSI: The RSI has been declining, indicating a weakening momentum.
- Stochastic Oscillator: Both %K and %D have been decreasing, signaling a bearish momentum.
- Williams %R: The indicator has been in oversold territory, suggesting a potential reversal.
Volatility Indicators:
- Bollinger Bands (BB): The stock price has been trading below the lower Bollinger Band, indicating oversold conditions.
- Bollinger Band Width (BBW): The BBW has been widening, suggesting increased volatility.
- Bollinger Band %B (BBP): The %B has been below 0.2, indicating potential oversold conditions.
Volume Indicators:
- On-Balance Volume (OBV): The OBV has been declining, indicating selling pressure.
- Chaikin Money Flow (CMF): The CMF has been negative, suggesting outflow of money from the stock.
Key Observations and Opinions:
- Trend: The trend indicators show a mixed signal with a short-term bearish bias but potential reversal signs.
- Momentum: Momentum indicators suggest a bearish momentum with oversold conditions.
- Volatility: Volatility indicators point towards increased volatility and potential oversold conditions.
- Volume: Volume indicators indicate selling pressure and negative money flow.
Conclusion:
Based on the analysis of the technical indicators, the stock price of TSLY is likely to experience further downward movement in the coming days. The bearish momentum, oversold conditions, and negative volume indicators all point towards a continuation of the current downtrend. Traders and investors should exercise caution and consider waiting for more definitive signs of a reversal before considering long positions.