Technical Analysis of TYLG 2024-05-31
Overview:
In analyzing the technical indicators for TYLG over the last 5 days, we will delve into the trend, momentum, volatility, and volume indicators to provide a comprehensive outlook on the possible stock price movement in the coming days.
Trend Analysis:
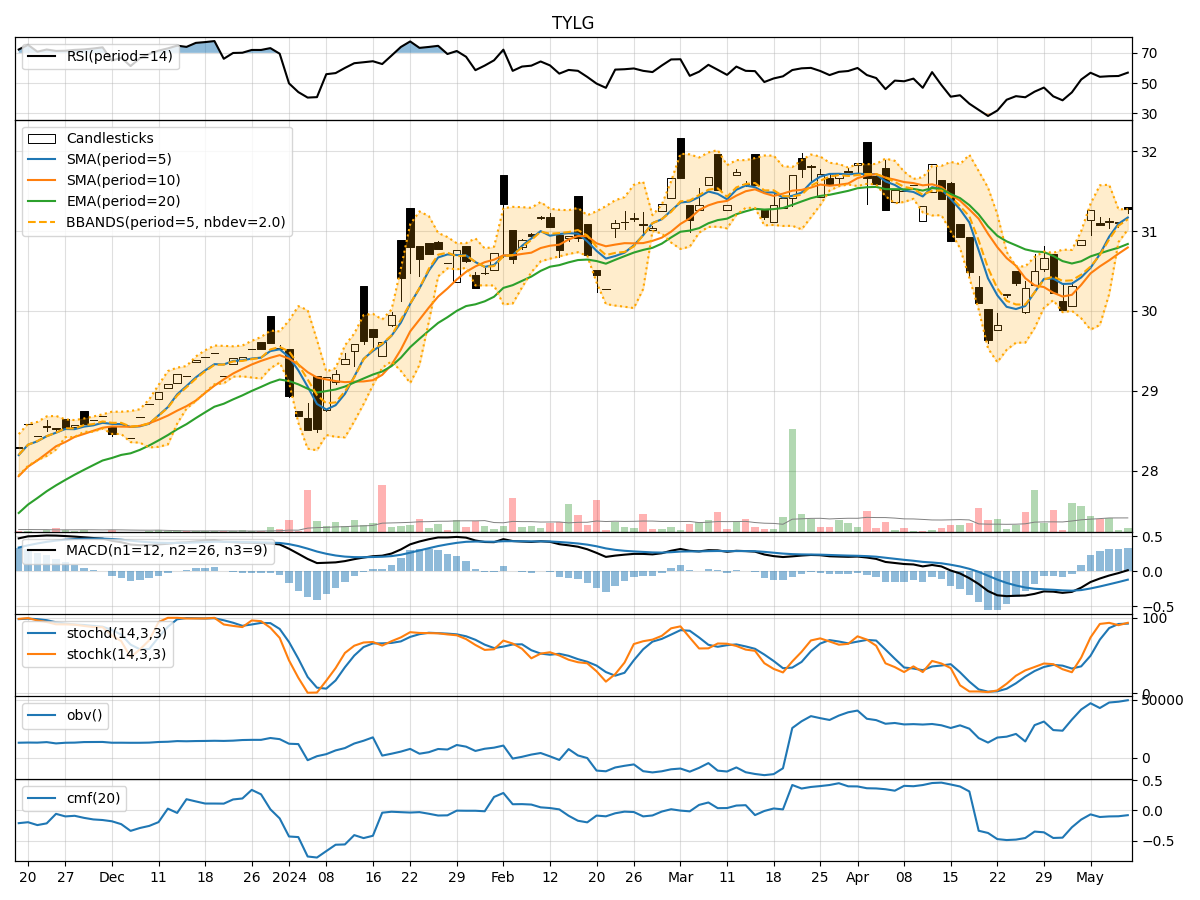
- Moving Averages (MA): The 5-day Moving Average (MA) has been fluctuating around the closing prices, indicating short-term price trends. The Simple Moving Average (SMA) and Exponential Moving Average (EMA) have been showing slight upward movements.
- MACD: The Moving Average Convergence Divergence (MACD) has been positive, with the MACD line consistently above the signal line, suggesting bullish momentum.
- MACD Histogram: The MACD Histogram has been positive, indicating an increase in bullish momentum.
Momentum Analysis:
- RSI: The Relative Strength Index (RSI) has been fluctuating but generally staying within the neutral range, indicating a balanced momentum.
- Stochastic Oscillator: The Stochastic Oscillator has been fluctuating, showing mixed signals with no clear trend direction.
- Williams %R: The Williams %R has been in the oversold territory, suggesting a potential reversal in the short term.
Volatility Analysis:
- Bollinger Bands (BB): The Bollinger Bands have been widening, indicating increased volatility in the stock price.
- Bollinger %B: The Bollinger %B has been fluctuating around the midline, suggesting a neutral stance in terms of volatility.
Volume Analysis:
- On-Balance Volume (OBV): The OBV has been fluctuating, indicating mixed buying and selling pressure.
- Chaikin Money Flow (CMF): The CMF has been negative, suggesting a bearish outlook on the stock.
Key Observations:
- The trend indicators suggest a bullish sentiment with positive MACD and MACD Histogram.
- Momentum indicators show mixed signals with RSI in a neutral range and Stochastic Oscillator fluctuating.
- Volatility has increased as seen in the widening Bollinger Bands.
- Volume indicators indicate mixed buying and selling pressure with a negative CMF.
Conclusion:
Based on the analysis of the technical indicators, the stock price of TYLG is likely to experience further upward movement in the coming days. The bullish trend indicated by the positive MACD and MACD Histogram, along with the slight upward movement in moving averages, suggests a potential continuation of the positive momentum. However, the mixed signals from momentum indicators and negative CMF warrant caution, indicating the possibility of short-term fluctuations.
Recommendation:
- Short-term Traders: Consider taking advantage of potential upward movements but remain cautious of mixed signals from momentum indicators.
- Long-term Investors: Monitor the trend closely and consider the overall market conditions before making significant investment decisions.
Disclaimer:
This analysis is based solely on technical indicators and does not take into account fundamental factors or external market influences. It is essential to conduct thorough research and consider multiple factors before making any investment decisions.