Technical Analysis of TYO 2024-05-31
Overview:
In analyzing the technical indicators for TYO stock over the last 5 days, we will delve into the trend, momentum, volatility, and volume indicators to provide a comprehensive outlook on the possible stock price movement in the coming days. By examining these key indicators, we aim to offer valuable insights and recommendations for potential investors.
Trend Analysis:
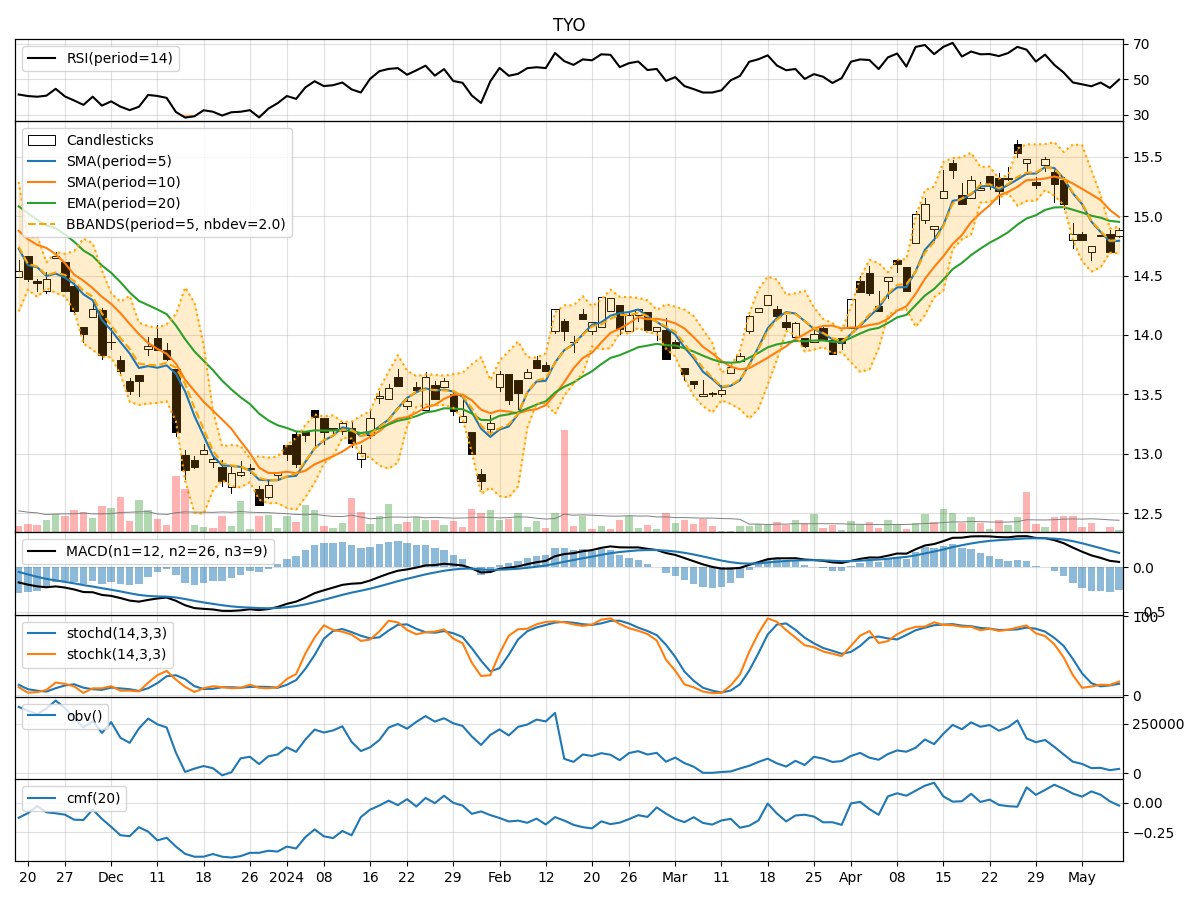
- Moving Averages (MA): The 5-day Moving Average (MA) has been trending upwards, indicating a positive momentum in the short term.
- MACD: The Moving Average Convergence Divergence (MACD) has shown positive values, suggesting a bullish trend.
- EMA: The Exponential Moving Average (EMA) has been consistently rising, supporting the bullish sentiment in the market.
Momentum Analysis:
- RSI: The Relative Strength Index (RSI) has been fluctuating around the neutral zone, indicating a balanced momentum.
- Stochastic Oscillator: Both %K and %D values have been relatively high, suggesting a bullish momentum.
- Williams %R: The Williams %R indicator has been in the oversold territory, signaling a potential reversal in the momentum.
Volatility Analysis:
- Bollinger Bands (BB): The Bollinger Bands have shown narrowing bands, indicating decreasing volatility in the stock.
- BB% (Bollinger Band %B): The %B value has been hovering around the middle, suggesting a period of consolidation.
- Average True Range (ATR): The ATR values have been relatively stable, indicating a lack of significant price fluctuations.
Volume Analysis:
- On-Balance Volume (OBV): The OBV has been negative, indicating a net selling pressure in the stock.
- Chaikin Money Flow (CMF): The CMF has been positive, suggesting a potential inflow of money into the stock.
Key Observations:
- The trend indicators point towards a bullish sentiment in the short term.
- Momentum indicators show a mixed signal with a slight bullish bias.
- Volatility indicators suggest a period of consolidation and decreased price fluctuations.
- Volume indicators indicate a selling pressure but with a potential influx of money into the stock.
Conclusion:
Based on the analysis of the technical indicators, the next few days for TYO stock are likely to see upward movement with a bullish bias. Investors may consider entering long positions or holding onto existing positions to capitalize on the expected price appreciation. However, it is essential to monitor the indicators closely for any signs of reversal or change in market sentiment.