Technical Analysis of UDOW 2024-05-31
Overview:
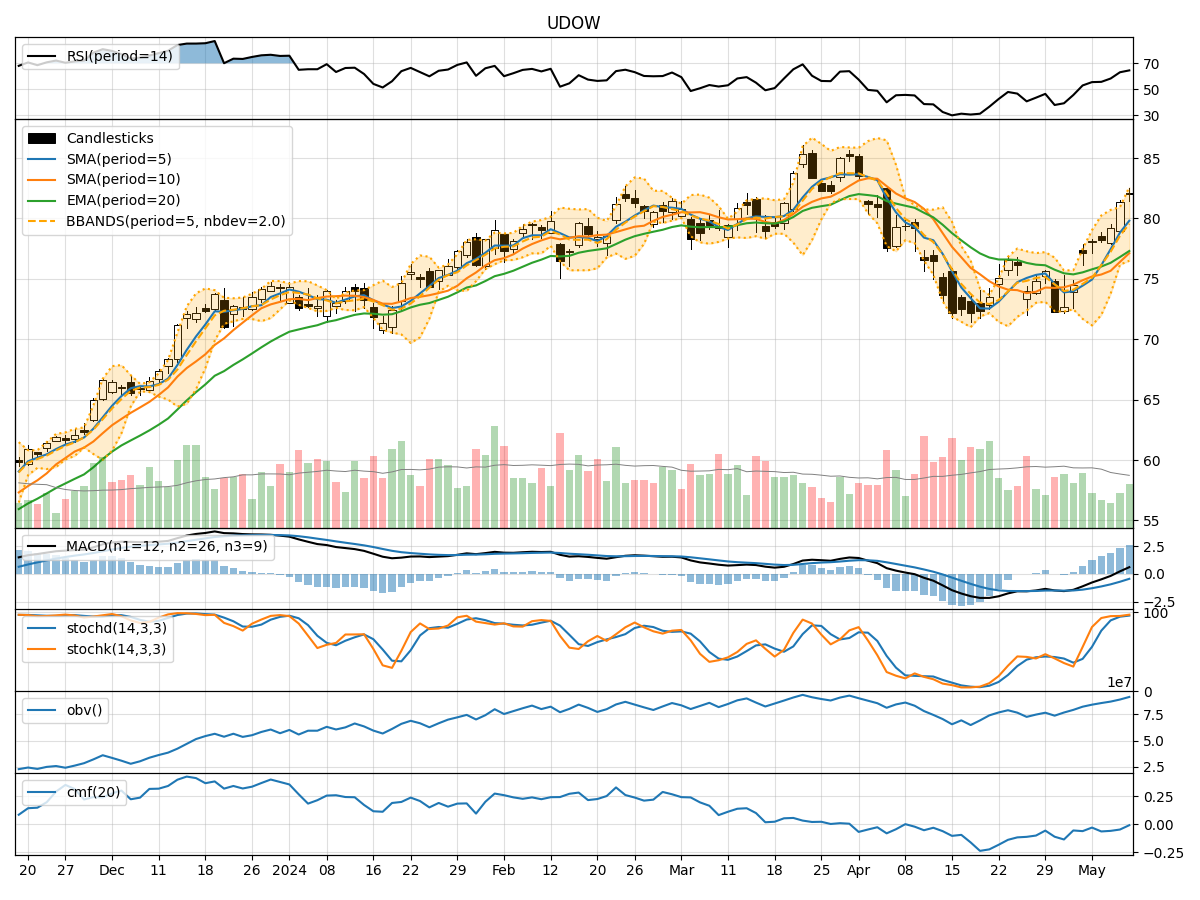
In analyzing the technical indicators for UDOW over the last 5 days, we will delve into the trends, momentum, volatility, and volume indicators to provide a comprehensive outlook on the possible stock price movement in the coming days. By examining these key aspects, we aim to offer valuable insights and recommendations for potential investors.
Trend Analysis:
- Moving Averages (MA): The 5-day MA has been consistently below the longer-term SMAs and EMAs, indicating a downward trend in the stock price.
- MACD: The MACD line has been below the signal line, with decreasing values over the past 5 days, suggesting a bearish momentum.
- RSI: The RSI has been declining and is currently below 50, indicating a weakening momentum in the stock price.
Momentum Analysis:
- Stochastic Oscillator: Both %K and %D have been decreasing, reaching oversold levels, signaling a potential reversal or consolidation.
- Williams %R: The indicator has been in oversold territory, suggesting a possible bounce back in the stock price.
Volatility Analysis:
- Bollinger Bands: The stock price has been consistently trading below the lower Bollinger Band, indicating oversold conditions.
- Volatility Bands: The bands have been narrowing, suggesting a potential decrease in volatility and a possible consolidation phase.
Volume Analysis:
- On-Balance Volume (OBV): The OBV has been fluctuating, indicating indecision among investors regarding the stock.
- Chaikin Money Flow (CMF): The CMF has been negative, reflecting selling pressure in the stock.
Key Observations:
- The stock is currently in a downtrend based on moving averages and MACD.
- Momentum indicators like RSI and Stochastic Oscillator suggest oversold conditions and a potential reversal.
- Volatility indicators point towards a decrease in volatility and a possible consolidation phase.
- Volume indicators show indecisiveness among investors, with selling pressure reflected in the CMF.
Conclusion:
Based on the technical analysis of UDOW, the stock is currently in a downtrend with oversold conditions. However, the momentum indicators suggest a potential reversal or consolidation in the near future. The decrease in volatility and indecision among investors further support the possibility of a sideways movement or a slight rebound in the stock price. Investors should closely monitor key support and resistance levels for potential entry or exit points, considering the overall market sentiment and broader economic factors.