Technical Analysis of UJAN 2024-05-31
Overview:
In analyzing the technical indicators for UJAN stock over the last 5 days, we will delve into the trend, momentum, volatility, and volume indicators to provide a comprehensive outlook on the possible future stock price movement. By examining these key indicators, we aim to offer valuable insights and recommendations for potential investors.
Trend Analysis:
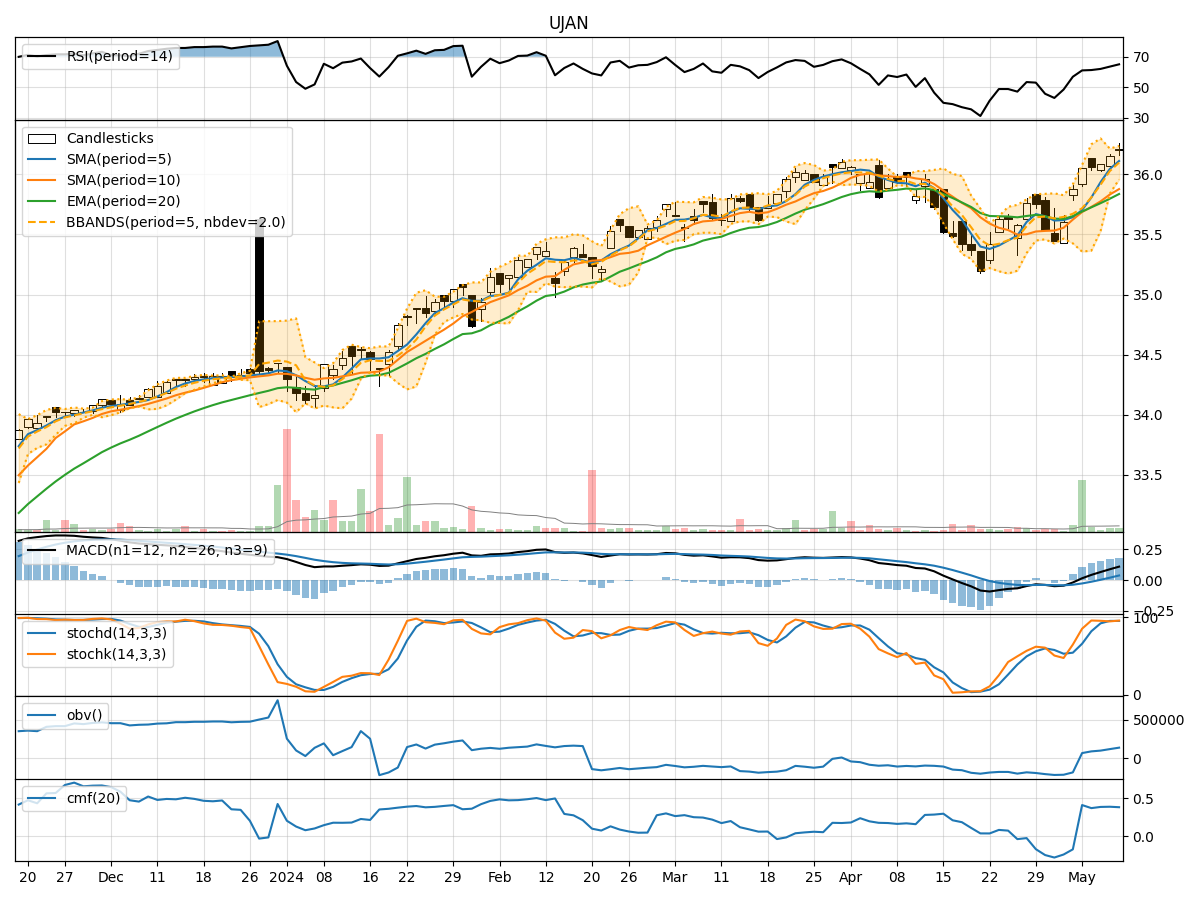
- Moving Averages (MA): The 5-day Moving Average (MA) has been relatively stable around the closing prices, indicating a consistent trend.
- MACD: The Moving Average Convergence Divergence (MACD) has shown a slight decrease in the MACD line compared to the Signal line, suggesting a potential weakening of the bullish momentum.
- RSI: The Relative Strength Index (RSI) has fluctuated but remains in the neutral zone, indicating a balanced buying and selling pressure.
Momentum Analysis:
- Stochastic Oscillator: The Stochastic Oscillator has been declining, moving towards the oversold territory, signaling a potential reversal in the short-term momentum.
- Williams %R: The Williams %R indicator has shown a sharp decline, indicating an oversold condition and a possible upcoming reversal.
Volatility Analysis:
- Bollinger Bands: The Bollinger Bands have shown a narrowing of the bands, suggesting a decrease in volatility and a potential period of consolidation.
- Average True Range (ATR): The ATR has decreased, indicating a reduction in price volatility over the last few days.
Volume Analysis:
- On-Balance Volume (OBV): The OBV has shown a slight decrease, suggesting a divergence between price and volume, which could indicate weakening buying pressure.
- Chaikin Money Flow (CMF): The CMF has been relatively stable, indicating a consistent inflow of money into the stock over the past 20 days.
Conclusion:
Based on the analysis of the technical indicators, the stock of UJAN is likely to experience sideways movement in the next few days. The decreasing momentum indicators, coupled with the narrowing Bollinger Bands and decreasing volatility, suggest a period of consolidation. The declining Stochastic Oscillator and Williams %R point towards a potential short-term reversal or correction. Additionally, the stable OBV and CMF indicate a balanced flow of money into the stock.
In conclusion, the overall technical outlook for UJAN stock suggests a neutral to slightly bearish bias in the short term. Investors should closely monitor key support and resistance levels for potential entry or exit points, considering the possibility of a sideways trend with a slight downward bias.