Technical Analysis of URTH 2024-05-31
Overview:
In analyzing the technical indicators for URTH over the last 5 days, we will delve into the trend, momentum, volatility, and volume indicators to provide a comprehensive outlook on the possible stock price movement in the coming days. By examining these key aspects, we aim to offer valuable insights and predictions to guide investment decisions.
Trend Indicators:
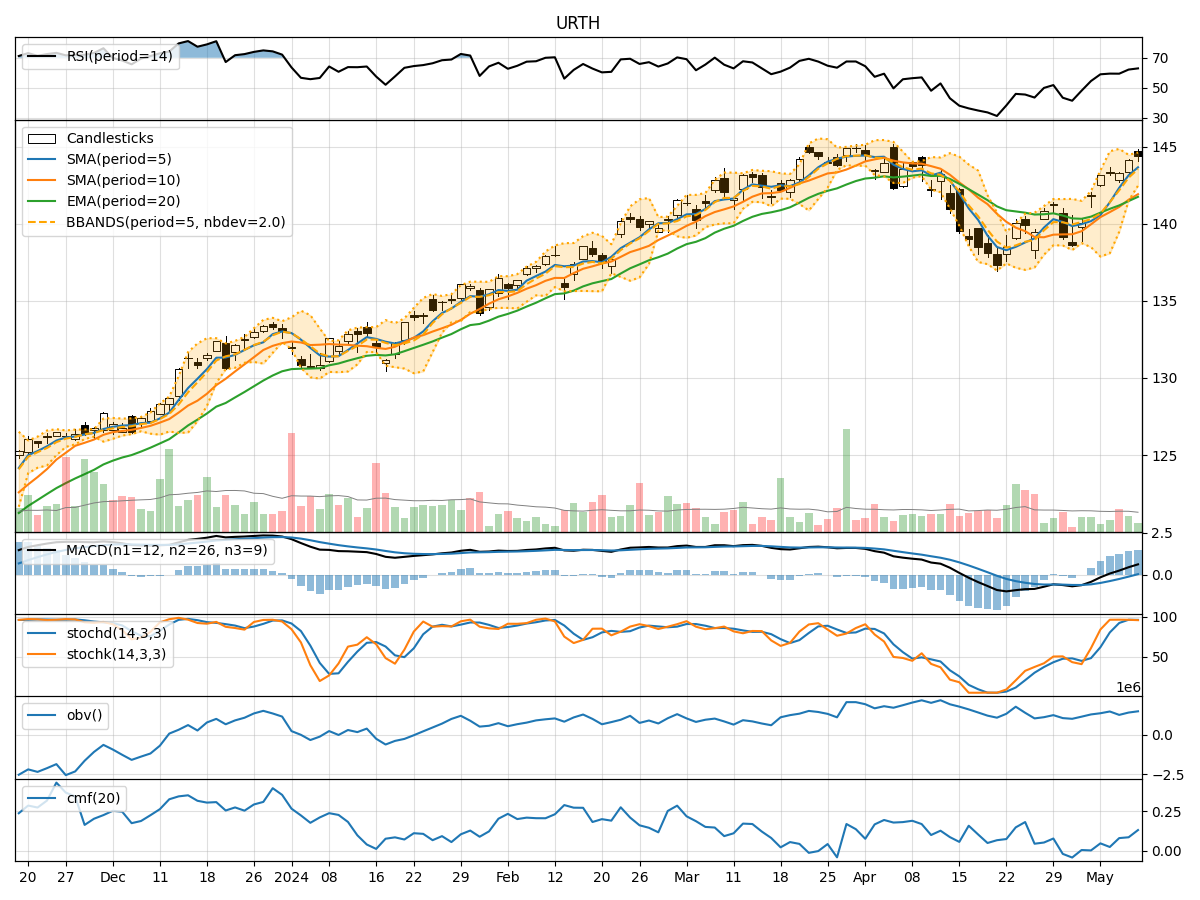
- Moving Averages (MA): The 5-day MA has been fluctuating around the closing prices, indicating short-term price trends. The SMA(10) and EMA(20) have shown a slight upward trend, suggesting potential support levels.
- MACD: The MACD line has been positive, indicating bullish momentum, although the MACD Histogram has been decreasing, signaling a potential slowdown in the uptrend.
Momentum Indicators:
- RSI: The RSI has been fluctuating around the neutral zone, indicating indecision in the market.
- Stochastic Oscillator: Both %K and %D have been declining, suggesting a potential bearish momentum.
- Williams %R: The indicator has been in oversold territory, indicating a possible reversal in the short term.
Volatility Indicators:
- Bollinger Bands: The bands have been narrowing, indicating decreasing volatility and a potential consolidation phase.
- Bollinger %B: The %B indicator has been hovering around the middle range, suggesting a balanced market sentiment.
Volume Indicators:
- On-Balance Volume (OBV): The OBV has shown mixed signals, reflecting uncertainty in the accumulation/distribution of the stock.
- Chaikin Money Flow (CMF): The CMF has been positive, indicating buying pressure in the market.
Key Observations and Opinions:
- Trend: The trend indicators suggest a mixed outlook, with a potential for a short-term uptrend but signs of a slowdown.
- Momentum: Momentum indicators point towards a bearish bias, with the stochastic oscillator and Williams %R signaling potential downward pressure.
- Volatility: Volatility indicators indicate a consolidation phase, with decreasing volatility and a balanced market sentiment.
- Volume: Volume indicators show mixed signals, reflecting uncertainty in market participation and accumulation.
Conclusion:
Based on the analysis of the technical indicators, the next few days for URTH could see sideways movement with a slight bearish bias. Traders should exercise caution and closely monitor key support and resistance levels. Consider implementing risk management strategies to navigate the potential market uncertainty.