Technical Analysis of USSH 2024-05-31
Overview:
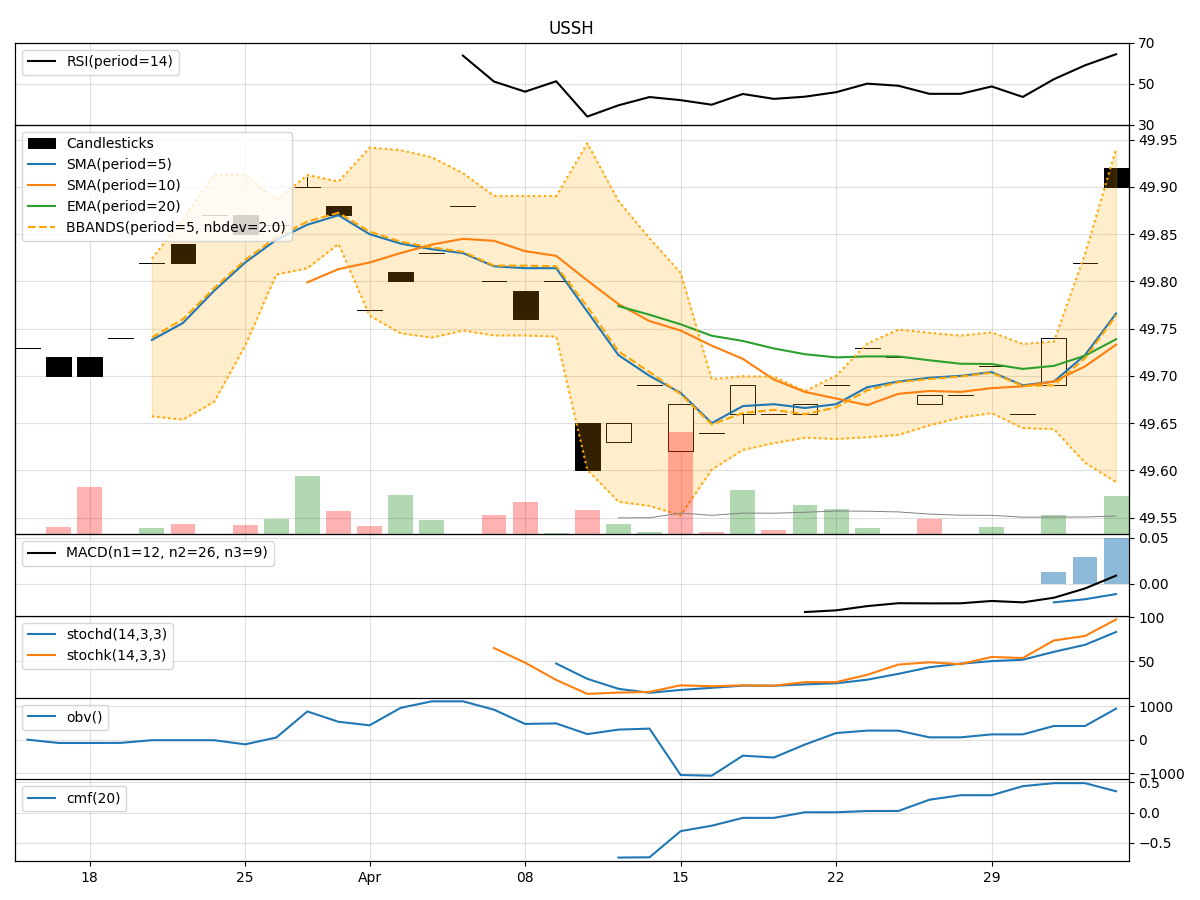
In analyzing the technical indicators for USSH stock over the last 5 days, we will delve into the trend, momentum, volatility, and volume indicators to provide a comprehensive outlook on the possible stock price movement in the coming days. By examining these key indicators, we aim to offer valuable insights and predictions for potential investors.
Trend Indicators:
- Moving Averages (MA): The 5-day MA has been fluctuating around the closing prices, indicating a lack of clear trend direction.
- MACD: The MACD line has been positive but decreasing, while the MACD Histogram has been consistently negative, suggesting a potential bearish momentum.
- EMA: The EMA has been relatively stable but showing a slight downward trend.
Momentum Indicators:
- RSI: The RSI has been fluctuating around the mid-level, indicating a lack of strong momentum in either direction.
- Stochastic Oscillator: Both %K and %D have been relatively low, suggesting a lack of strong buying or selling pressure.
- Williams %R: The indicator has been hovering in the oversold territory, indicating a potential reversal in the short term.
Volatility Indicators:
- Bollinger Bands (BB): The bands have been narrowing, indicating decreasing volatility in the stock price.
- BB %B: The %B has been fluctuating around the midline, suggesting a neutral stance in terms of volatility.
- BB Width: The narrowing of the bands suggests a potential breakout or significant price movement in the near future.
Volume Indicators:
- On-Balance Volume (OBV): The OBV has been fluctuating, indicating a balance between buying and selling pressure.
- Chaikin Money Flow (CMF): The CMF has been negative, suggesting a net outflow of money from the stock.
Key Observations and Opinions:
- Trend: The trend indicators show a lack of clear direction, with a potential bearish bias due to the negative MACD Histogram.
- Momentum: Momentum indicators suggest a neutral to slightly bearish sentiment, with the Williams %R indicating a possible oversold condition.
- Volatility: Volatility has been decreasing, indicating a period of consolidation or potential breakout.
- Volume: The volume indicators show a balance between buying and selling pressure, with a slight negative bias indicated by the CMF.
Conclusion:
Based on the analysis of the technical indicators, the USSH stock is likely to experience sideways movement in the coming days, with a potential bearish bias due to the negative MACD Histogram and overall lack of strong bullish momentum. Traders should exercise caution and wait for clearer signals before making significant trading decisions.