Technical Analysis of VCSH 2024-05-31
Overview:
In analyzing the technical indicators for VCSH over the last 5 days, we will delve into the trend, momentum, volatility, and volume indicators to provide a comprehensive outlook on the possible stock price movement in the coming days. By examining these key aspects, we aim to offer valuable insights and predictions for informed decision-making.
Trend Indicators:
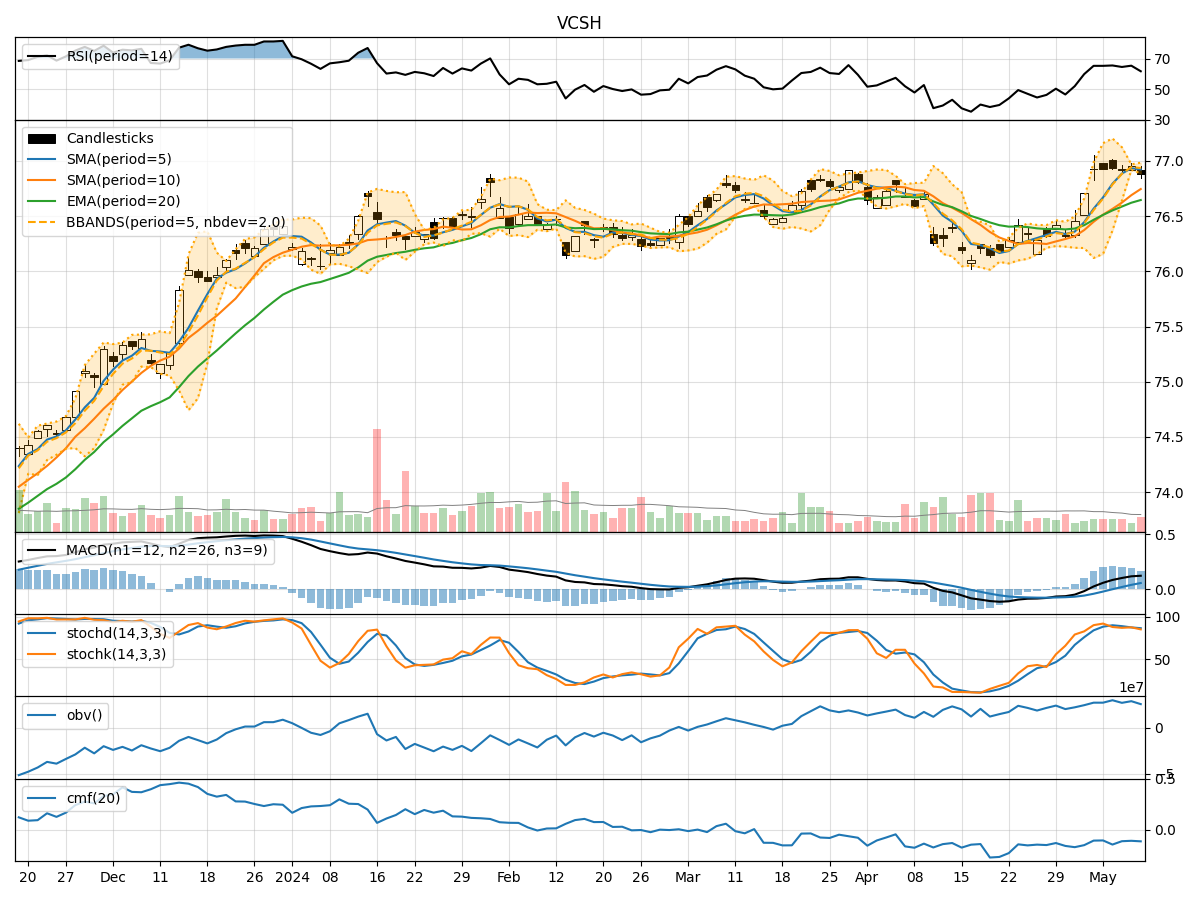
- Moving Averages (MA): The 5-day MA has been fluctuating around the $77 mark, indicating a relatively stable trend in the short term.
- MACD: The MACD line has been positive, albeit with a slight decrease in momentum over the past few days.
- EMA: The EMA has shown a slight upward trend, suggesting a potential bullish sentiment in the stock.
Key Observation: The trend indicators suggest a neutral to slightly bullish outlook for VCSH.
Momentum Indicators:
- RSI: The RSI has been fluctuating around the mid-level, indicating a balanced momentum between buying and selling pressure.
- Stochastic Oscillator: Both %K and %D have shown mixed signals, with %K hovering around the neutral zone.
- Williams %R: The indicator has been in the oversold territory, signaling a potential reversal in the stock price.
Key Observation: Momentum indicators reflect a neutral stance with a slight inclination towards a bullish reversal.
Volatility Indicators:
- Bollinger Bands: The bands have shown narrowing volatility, suggesting a potential decrease in price fluctuations.
- Bollinger %B: The %B indicator has been fluctuating, indicating a mixed sentiment among traders regarding the stock's volatility.
Key Observation: Volatility indicators point towards a consolidation phase with reduced price swings.
Volume Indicators:
- On-Balance Volume (OBV): The OBV has shown a slight decrease, indicating a potential distribution phase among investors.
- Chaikin Money Flow (CMF): The CMF has been negative, signaling a bearish sentiment in terms of money flow.
Key Observation: Volume indicators suggest a bearish sentiment with a decrease in buying pressure.
Conclusion:
Based on the analysis of trend, momentum, volatility, and volume indicators, the overall outlook for VCSH in the next few days leans towards a sideways consolidation with a slight bullish bias. Traders should closely monitor key levels and wait for a clearer trend confirmation before making significant trading decisions. It is advisable to exercise caution and consider implementing risk management strategies in the current market environment.