Technical Analysis of VIOG 2024-05-31
Overview:
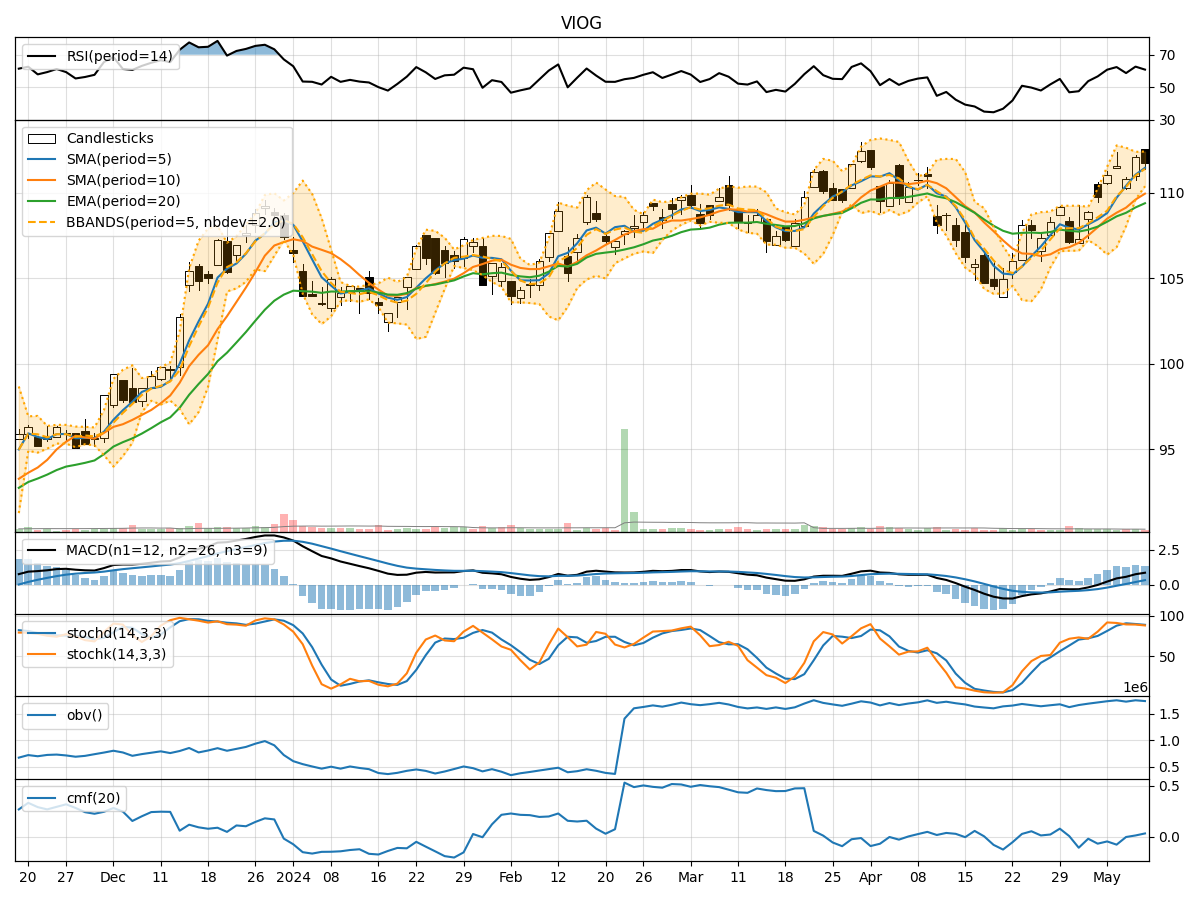
In analyzing the technical indicators for VIOG over the last 5 days, we will delve into the trend, momentum, volatility, and volume indicators to provide a comprehensive outlook on the possible stock price movement in the coming days. By examining these key aspects, we aim to offer valuable insights and predictions for potential investors.
Trend Indicators:
- Moving Averages (MA): The 5-day MA has been slightly decreasing, indicating a short-term downtrend.
- MACD: The MACD line has been consistently below the signal line, suggesting a bearish momentum.
- EMA: The EMA has been fluctuating but generally below the current price, signaling a potential bearish trend.
Momentum Indicators:
- RSI: The RSI has been fluctuating around the 50 level, indicating a lack of strong momentum in either direction.
- Stochastic Oscillator: Both %K and %D have been in the oversold region, suggesting a potential reversal to the upside.
- Williams %R: The indicator has been in the oversold territory, indicating a possible buying opportunity.
Volatility Indicators:
- Bollinger Bands (BB): The bands have been narrowing, indicating decreasing volatility and a potential upcoming price breakout.
- BB %B: The %B indicator has been fluctuating within a narrow range, suggesting a period of consolidation.
- BB Width: The width of the bands has been decreasing, indicating a potential decrease in volatility.
Volume Indicators:
- On-Balance Volume (OBV): The OBV has shown mixed signals, with some days seeing an increase in volume and others a decrease.
- Chaikin Money Flow (CMF): The CMF has been slightly positive, indicating some buying pressure in the market.
Conclusion:
Based on the analysis of the technical indicators, the stock of VIOG is currently exhibiting a mixed outlook. The trend indicators suggest a slight bearish bias, while momentum indicators show a potential for a reversal to the upside. Volatility indicators point towards a period of consolidation, and volume indicators indicate mixed trading activity.
Overall Assessment:
- Trend: Slightly Bearish
- Momentum: Potential Reversal to the Upside
- Volatility: Consolidation Phase
- Volume: Mixed Trading Activity
Recommendation:
Considering the mixed signals from the technical indicators, it is advisable for investors to exercise caution and closely monitor the stock's price action in the coming days. A prudent approach would be to wait for more clarity in the market direction before making any significant trading decisions.