Technical Analysis of VSHY 2024-05-31
Overview:
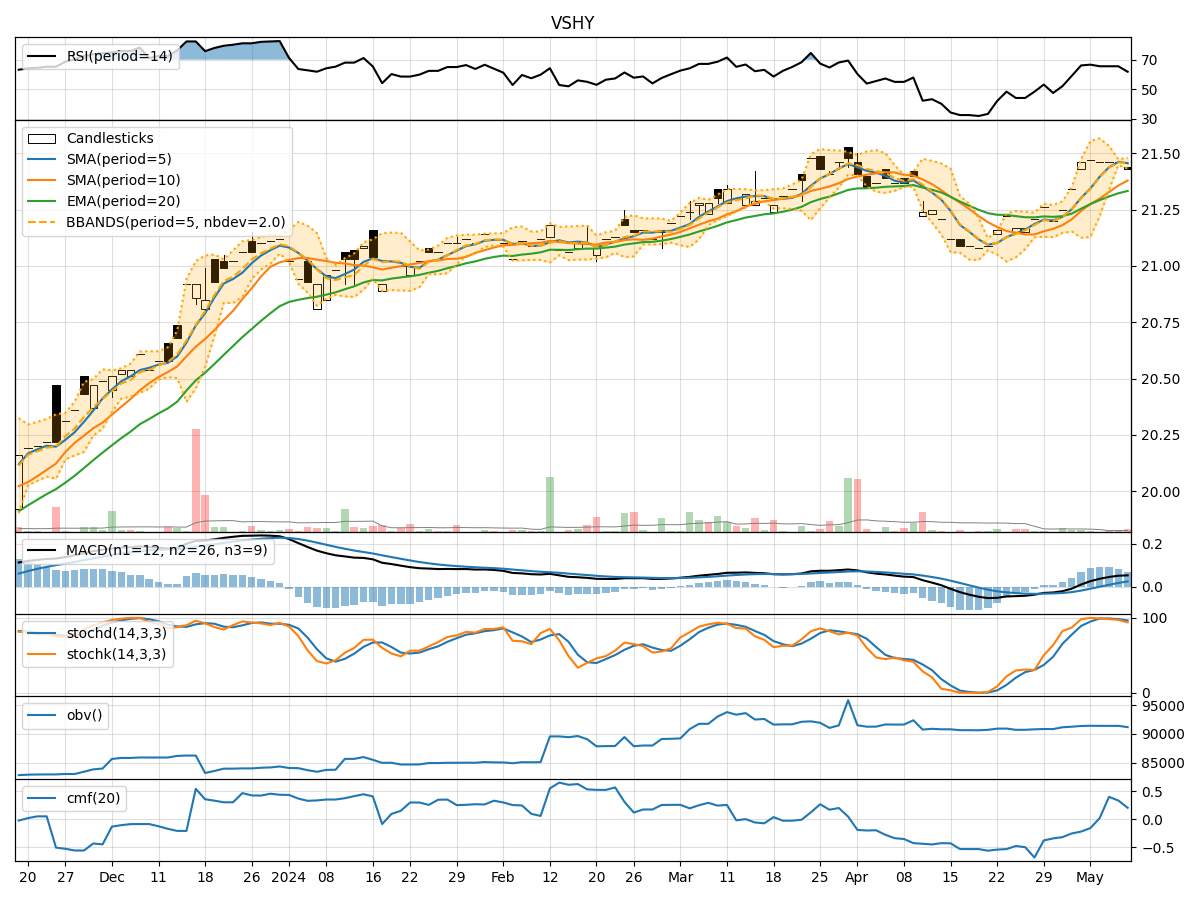
In analyzing the technical indicators for VSHY over the last 5 days, we will delve into the trends, momentum, volatility, and volume indicators to provide a comprehensive outlook on the possible stock price movement in the coming days.
Trend Analysis:
- Moving Averages (MA): The 5-day MA has been fluctuating around the closing prices, indicating a lack of clear trend direction.
- MACD: The MACD line has been positive but decreasing, while the MACD Histogram has been consistently negative, suggesting a potential bearish momentum.
Momentum Analysis:
- RSI: The RSI has been oscillating around the mid-level, indicating a neutral momentum.
- Stochastic Oscillator: Both %K and %D have been fluctuating, showing indecision in momentum.
Volatility Analysis:
- Bollinger Bands (BB): The stock price has been trading within the bands, with the %B indicator fluctuating around the midline, suggesting a period of consolidation.
Volume Analysis:
- On-Balance Volume (OBV): The OBV has been relatively flat, indicating a balance between buying and selling pressure.
- Chaikin Money Flow (CMF): The CMF has been positive but not showing significant strength in buying pressure.
Key Observations:
- The stock is currently in a consolidation phase with no clear trend direction.
- Momentum indicators are neutral, indicating indecision among traders.
- Volatility is low, suggesting a lack of significant price movements.
- Volume indicators show a balance between buying and selling pressure.
Conclusion:
Based on the analysis of the technical indicators, the next few days for VSHY are likely to see sideways movement with limited price fluctuations. The stock is expected to continue trading within a narrow range as traders await a clear signal for a new trend to emerge. No significant bullish or bearish bias is evident in the current market conditions. It is advisable for investors to exercise caution and wait for a clearer trend to develop before making any significant trading decisions.