Technical Analysis of VUSE 2024-05-31
Overview:
In analyzing the technical indicators for VUSE stock over the last 5 days, we will delve into the trend, momentum, volatility, and volume indicators to provide a comprehensive outlook on the possible future stock price movement. By examining these key indicators, we aim to offer valuable insights and predictions for the upcoming trading days.
Trend Analysis:
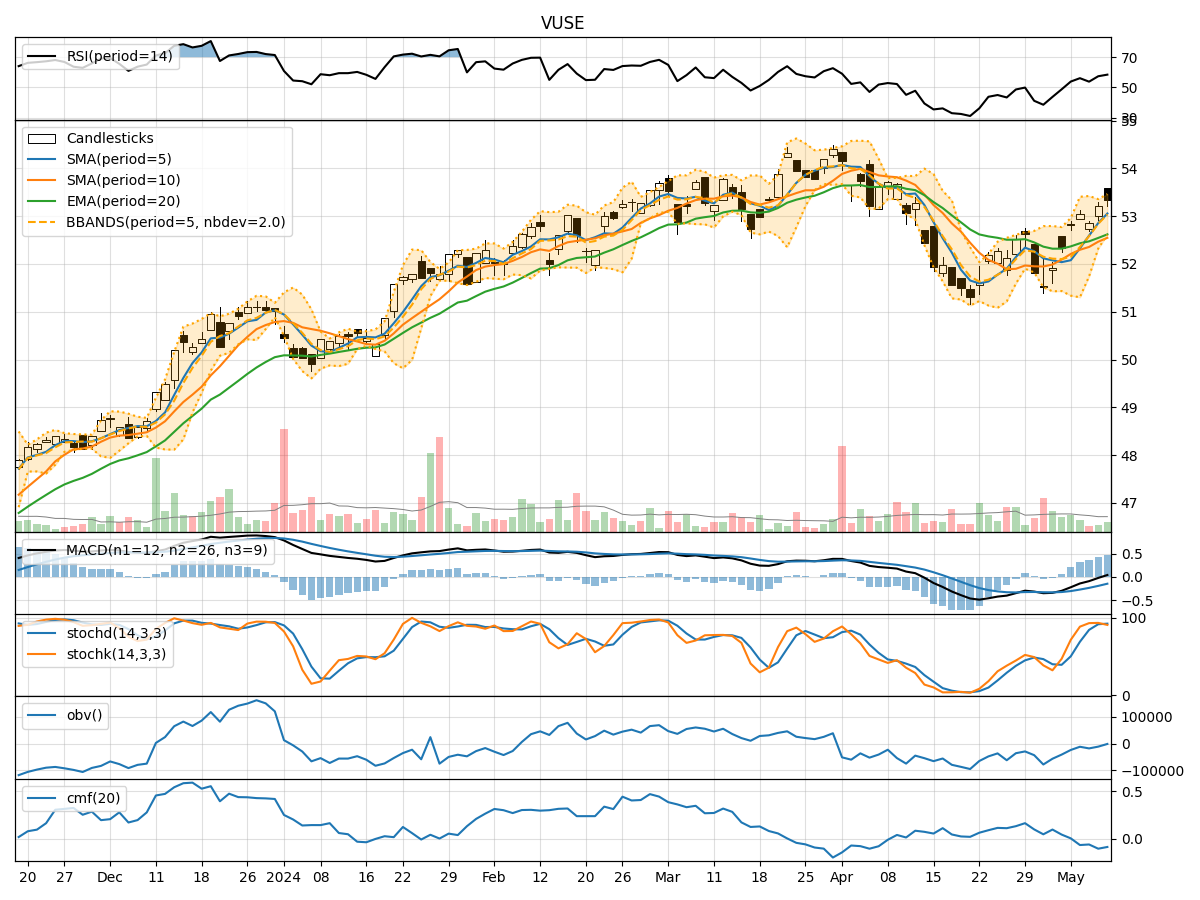
- Moving Averages (MA): The 5-day Moving Average (MA) has been consistently below the closing prices, indicating a short-term downtrend.
- MACD: The MACD line has been positive but decreasing, while the MACD Histogram has been negative, suggesting a weakening bullish momentum.
- EMA: The Exponential Moving Average (EMA) has been declining, reflecting a bearish sentiment in the short to medium term.
Momentum Analysis:
- RSI: The Relative Strength Index (RSI) has been decreasing, indicating a loss of bullish momentum.
- Stochastic Oscillator: Both %K and %D have been declining, signaling a potential oversold condition.
- Williams %R: The Williams %R has been consistently in the oversold territory, suggesting a bearish sentiment.
Volatility Analysis:
- Bollinger Bands (BB): The stock price has been trading within the lower Bollinger Band, indicating a potential oversold condition.
- Bollinger Band Width: The Band Width has been narrowing, suggesting decreasing volatility.
- Bollinger Band %B: The %B indicator has been below 0.2, indicating a potential buying opportunity.
Volume Analysis:
- On-Balance Volume (OBV): The OBV has been negative, indicating distribution and selling pressure.
- Chaikin Money Flow (CMF): The CMF has been negative, reflecting a lack of buying interest and potential bearish sentiment.
Conclusion:
Based on the analysis of the technical indicators, the stock is currently in a downtrend with weakening bullish momentum and increasing selling pressure. The indicators suggest a potential oversold condition and a lack of buying interest in the market. Therefore, the next few days are likely to see a continuation of the downward movement in the stock price.
Recommendation:
Considering the bearish outlook and the technical signals pointing towards further downside potential, it is advisable to exercise caution and consider short-term selling strategies or wait for a clear reversal signal before considering any long positions. Monitoring key support levels and waiting for a bullish confirmation would be prudent before considering any bullish positions.