Technical Analysis of WBAT 2024-05-31
Overview:
In analyzing the technical indicators for WBAT over the last 5 days, we will delve into the trend, momentum, volatility, and volume indicators to provide a comprehensive outlook on the possible stock price movement in the coming days. By examining these key indicators, we aim to offer valuable insights and predictions for potential investors and traders.
Trend Analysis:
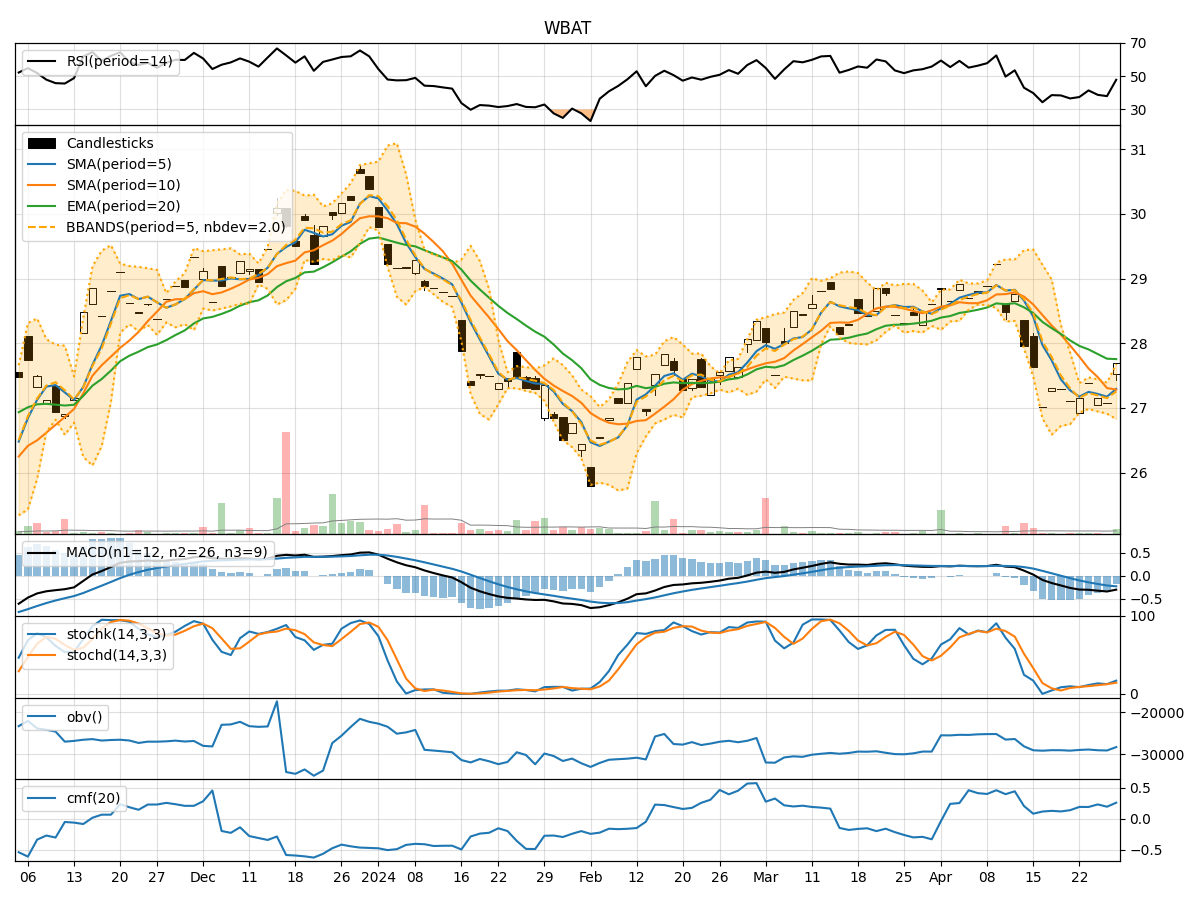
- Moving Averages (MA): The 5-day moving average has been fluctuating around the closing prices, indicating short-term price trends. The Simple Moving Average (SMA) and Exponential Moving Average (EMA) show a relatively stable trend.
- MACD: The MACD line has been positive, indicating a bullish trend, although the MACD Histogram has been decreasing slightly, suggesting a potential weakening of the bullish momentum.
Momentum Analysis:
- RSI: The Relative Strength Index (RSI) has been hovering around the mid-level, indicating a neutral momentum in the stock.
- Stochastic Oscillator: Both %K and %D have been fluctuating, showing indecision in momentum.
- Williams %R: The Williams %R has been in oversold territory, suggesting a potential reversal in momentum.
Volatility Analysis:
- Bollinger Bands: The Bollinger Bands have been relatively narrow, indicating low volatility in the stock price.
Volume Analysis:
- On-Balance Volume (OBV): The OBV has been fluctuating, indicating mixed buying and selling pressure.
- Chaikin Money Flow (CMF): The CMF has been negative, suggesting a bearish sentiment in the stock.
Key Observations:
- The stock has been trading within a narrow range with mixed signals from various indicators.
- The trend is relatively stable, but momentum and volume indicators show indecision and bearish sentiment.
- Volatility remains low, indicating a lack of significant price movements.
Conclusion:
Based on the analysis of the technical indicators, the stock is likely to experience sideways movement in the coming days. The lack of clear trends in momentum and volume, coupled with low volatility, suggests a period of consolidation or range-bound trading. Investors may consider waiting for clearer signals or confirmation of a new trend before making significant trading decisions.