Technical Analysis of WBIY 2024-05-31
Overview:
In analyzing the technical indicators for WBIY over the last 5 days, we will delve into the trend, momentum, volatility, and volume indicators to provide a comprehensive outlook on the possible stock price movement. By examining these key aspects, we aim to offer valuable insights and predictions for the upcoming days.
Trend Analysis:
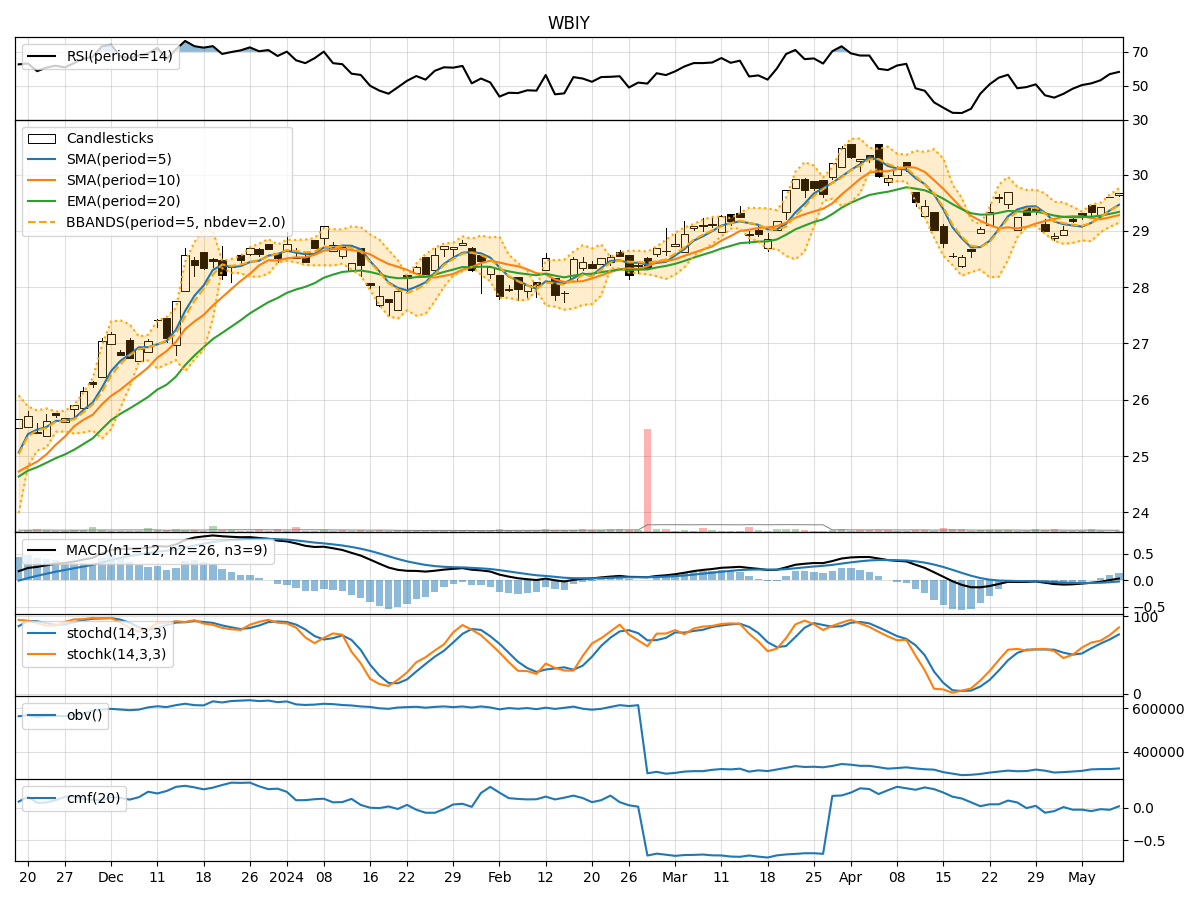
- Moving Averages (MA): The 5-day MA has been trending slightly below the closing prices, indicating a short-term bearish sentiment.
- MACD: The MACD line has been consistently below the signal line, suggesting a bearish trend in the stock.
- EMA: The EMA has been declining, reflecting a downward trend in the stock price.
Momentum Analysis:
- RSI: The RSI has been fluctuating in the oversold region, indicating a bearish momentum in the stock.
- Stochastic Oscillator: Both %K and %D have been in the oversold territory, signaling a potential reversal or continuation of the bearish trend.
- Williams %R: The Williams %R has been consistently in the oversold region, indicating a bearish sentiment.
Volatility Analysis:
- Bollinger Bands (BB): The stock price has been trading within the lower Bollinger Band, suggesting a period of low volatility and a potential oversold condition.
- Bollinger Band Width (BBW): The BBW has been narrowing, indicating a decrease in volatility and a possible consolidation phase.
Volume Analysis:
- On-Balance Volume (OBV): The OBV has shown mixed signals, with fluctuations in volume accumulation, reflecting indecision among market participants.
- Chaikin Money Flow (CMF): The CMF has been negative, indicating selling pressure and potential bearish sentiment.
Conclusion:
Based on the analysis of the technical indicators, the stock of WBIY is currently in a bearish phase with downward trends in moving averages, MACD, RSI, and stochastic indicators. The volatility is low, suggesting a possible consolidation phase, while volume indicators show mixed signals. Therefore, the next few days are likely to see a continuation of the bearish trend with a potential for further downside movement in the stock price. Traders and investors should exercise caution and consider risk management strategies in their decision-making process.